Reducing API latency is critical for better user experience and business outcomes. Here’s what you need to know:
- What is API Latency? It’s the time between sending a request and receiving the first byte of the response, often measured as Time to First Byte (TTFB).
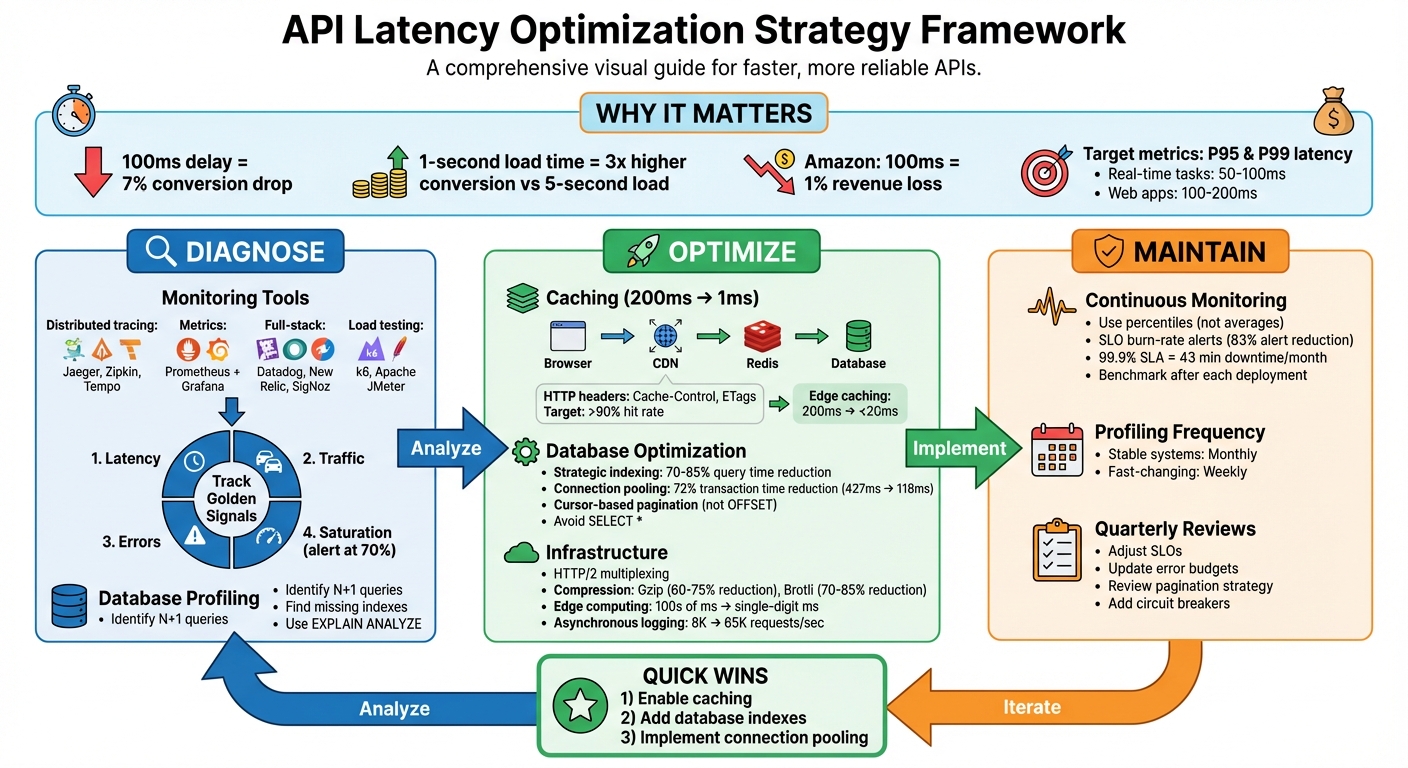
- Why it Matters: Even small delays can hurt conversion rates - 100ms can lead to a 7% drop. Latency impacts email marketing platforms, dashboards, and user satisfaction.
- Key Goals: Set measurable targets like P95 and P99 latency. For example, aim for 50–100ms for real-time tasks or 100–200ms for web apps.
Quick Fixes for Reducing Latency:
- Caching: Use multi-layer caching (Redis, CDNs, etc.) to cut response times.
- Database Optimization: Add indexes, use connection pooling, and switch to cursor-based pagination to speed up queries.
- Infrastructure: Leverage edge computing, HTTP/2, and compression (e.g., Gzip, Brotli) to minimize delays.
Tools to Pinpoint Issues:
- Monitoring: Use tools like Datadog, Prometheus, and OpenTelemetry for tracing and metrics.
- Load Testing: Tools like k6 and Apache JMeter help identify bottlenecks under stress.
By combining caching, query optimization, and infrastructure upgrades, you can significantly improve API performance while ensuring a smoother user experience.
API Latency Optimization: Complete Strategy Framework
Diagnosing Latency Problems
Using Monitoring Tools
Pinpointing latency issues starts with leveraging the right monitoring tools. Distributed tracing platforms like Jaeger, Zipkin, and Tempo provide a visual breakdown of how requests move through your system. These tools highlight where time is spent - whether it’s in your database, external API calls, or internal processes - giving you a clear picture of bottlenecks.
For tracking time-series metrics and creating real-time dashboards, Prometheus combined with Grafana has become a go-to solution. When setting up Prometheus, normalize endpoint paths (e.g., replace /api/users/123 with /api/users/{id}) to avoid high-cardinality data issues. Full-stack platforms like Datadog, New Relic, and the open-source SigNoz offer a comprehensive view, integrating traces, logs, and metrics in one place.
To test performance across different regions, tools like Checkly, Odown, and Postman Monitors simulate traffic from various locations, helping identify network-related delays. For load testing, k6 and Apache JMeter are excellent options to establish performance baselines and catch regressions during deployment. Meanwhile, frameworks like Encore.ts simplify distributed tracing by automatically capturing every database query and service call without requiring manual setup.
"Trace waterfalls are the single most powerful debugging tool in your observability toolkit. Learn to read them fluently, and production performance issues become solvable problems instead of mysteries."
- Nawaz Dhandala
When monitoring, prioritize the "Golden Signals": Latency, Traffic, Errors, and Saturation. Transitioning from static thresholds to SLO burn-rate alerts can cut down alert noise by as much as 83%, allowing you to focus on genuine performance degradations.
Once you’ve gathered external performance data, dive deeper into internal processes and database behavior for a more thorough understanding of latency issues.
Backend and Database Profiling
Armed with monitoring insights, backend profiling helps zero in on internal execution within your application and database operations. It’s crucial to distinguish self time (time spent in your code) from total duration (which includes waiting on external dependencies). High self time often points to inefficiencies in business logic, serialization, or framework overhead.
Database profiling frequently uncovers issues like missing indexes, where queries that should take milliseconds drag on for hundreds of milliseconds. Another common problem is N+1 queries, where similar queries are executed repeatedly, significantly slowing down performance. Tools like "Explain" plans and connection pooling can address these problems effectively.
For instance, in one e-commerce case, replacing an N+1 query pattern with a single JOIN reduced a trace from 51 spans to just one, cutting query time to 15ms. Similarly, implementing connection pooling reduced average latency by 150ms, which directly boosted conversion rates by 12%.
"Traces give you the timeline. Latency analysis gives you the story."
- Nawaz Dhandala, OneUptime
Third-Party Dependencies
Your system’s speed is only as good as its slowest dependency. For example, if a payment gateway takes 3 seconds to respond, your checkout process can’t be faster than that.
OpenTelemetry can assist by wrapping HTTP clients and tagging outbound requests with attributes like dependency.name and dependency.response_time_ms. This makes it easier to visualize the impact of third-party calls in your trace waterfall. Focus on dependencies in the "critical path" - the longest chain of dependent operations - because delays here directly increase overall request latency.
When working with multiple independent APIs, running them in parallel (e.g., using Promise.all in Node.js) can significantly reduce latency. Instead of waiting for each call to complete sequentially, the total time is limited to the slowest call. For non-essential tasks like sending confirmation emails or logging analytics, offloading them to background job queues ensures they don’t block your API response.
Set strict timeout values for external calls, based on their P99 latency. Also, define Service Level Objectives (SLOs) for each provider - for instance, ensuring Stripe maintains a P95 latency under 2 seconds - and set up alerts for threshold breaches. Combining synthetic checks with real user monitoring helps detect regional outages before customers encounter noticeable delays.
sbb-itb-6e7333f
Lessons from 72 Million API Calls (Don’t Make These Mistakes) | Push to Main! Meetup
Strategies to Reduce API Latency
Once you've identified the root causes of API delays, the next step is implementing strategies to improve response times. Key areas to focus on include caching, database query optimization, and infrastructure upgrades.
Caching for Faster Responses
Caching is one of the most effective ways to cut API latency. For example, caching can reduce a 200ms database query to just 1ms. A multi-layer caching stack is ideal, intercepting requests at various levels: browser cache, CDN or edge cache, reverse proxy cache, application cache (e.g., Redis or in-memory), and database query cache.
Start with HTTP headers as a quick fix. Using headers like Cache-Control (public, max-age=300) and ETags enables conditional requests, which can return a 304 Not Modified response instead of re-fetching data. For distributed systems, tools like Redis with an allkeys-lru eviction policy automatically manage memory by removing the least recently used items.
The cache-aside pattern (lazy loading) is a common approach: your application checks the cache first, and if there’s a miss, it fetches the data from the database and updates the cache for future requests. To take it further, use stale-while-revalidate (SWR). This method serves stale data instantly while refreshing it in the background, combining long TTL performance with short TTL freshness.
A real-world example: In February 2026, Easyparser combined SWR caching, connection pooling, and infrastructure optimization to achieve sub-3-second response times for Amazon data extraction - 2-5x faster than typical tools, with a 98.2% success rate.
Edge caching via CDNs like Cloudflare or AWS CloudFront can also make a huge difference, reducing latency from 200ms to under 20ms by storing responses closer to users. Use techniques like "Surrogate Keys" or "Cache Tags" for precise invalidation, allowing you to clear specific resources globally without flushing the entire cache. Aim for a cache hit rate above 90%; anything below 80% suggests poor TTL settings or caching the wrong data.
Once caching is optimized, the next step is improving database query performance.
Database Query Optimization
Even with caching, database performance can be a bottleneck. Optimizing queries and database operations is essential for reducing latency.
- Strategic indexing can reduce query times by 70-85% without changing application code. Create indexes tailored to your query patterns, including composite indexes for multi-column filters and partial indexes for common conditions.
- Use connection pooling to avoid the 20-50ms overhead of creating a new TCP/SSL connection for every request. Proper connection pooling can reduce transaction times by as much as 72%, dropping from 427ms to 118ms. PostgreSQL users can leverage tools like PgBouncer to manage thousands of connections efficiently.
- Switch from OFFSET-based to cursor-based pagination. OFFSET forces the database to scan and skip rows, while cursor-based queries (
WHERE id > lastId) use indexes for instant lookups, even with large datasets. - Avoid
SELECT *and fetch only the fields needed for the API response to minimize I/O and serialization overhead. - Regularly use tools like
EXPLAIN ANALYZEto identify slow queries andpg_stat_statementsto track high-latency operations. - Cache static lookup data (e.g., country codes or configuration flags) in a singleton within your API server to reduce repetitive database hits.
- For computationally expensive queries, consider materialized views. These pre-compute results during off-peak hours, so your API doesn’t have to calculate them on the fly.
Infrastructure Improvements
Beyond code and caching, infrastructure upgrades can significantly reduce latency.
- Edge computing brings data and computation closer to users, cutting round-trip times from hundreds of milliseconds to just a few. Pair this with global load balancers like AWS Route 53 or Google Cloud Load Balancer to distribute traffic based on user location and server capacity.
- Transition to HTTP/2, which supports multiplexing - allowing multiple requests to be processed over a single connection, reducing handshake overhead. Add "Keep-Alive" headers to maintain persistent client-server connections, avoiding repeated handshakes.
- Compress responses to shrink payload sizes. For instance, Gzip (level 6) can reduce a 1,000 KB JSON payload to 150 KB, while Brotli (level 4) can shrink it further to 110 KB. Offload compression to the edge by configuring CDNs like Cloudflare or Vercel to handle Gzip/Brotli, freeing up server CPU resources.
- Switch to asynchronous logging (e.g., using Pino) to increase API throughput from 8,000 requests per second to 65,000.
- Implement request collapsing to prevent redundant database queries for identical in-flight requests. This technique consolidates multiple requests into a single query and shares the result across all callers.
Advanced Techniques for Real-Time Performance
Building on earlier improvements in caching, queries, and infrastructure, these techniques take real-time API performance to the next level.
Asynchronous Processing and Request Batching
Asynchronous processing shifts heavy tasks - like sending emails, generating PDFs, or handling webhooks - out of the main request-response cycle. Instead of making users wait, the server immediately returns a 202 Accepted response with a job ID, while the actual task is handled in the background via job queues like BullMQ (Redis-backed), RabbitMQ, or AWS SQS. For context, SMTP operations can take anywhere from 500 milliseconds to 3 seconds, so offloading them can significantly improve how fast your API feels to users.
Request batching combines multiple operations into a single API call, cutting down on network overhead. Take GraphQL, for instance - it lets clients fetch multiple data points in one query, solving issues like over-fetching or under-fetching that often plague REST APIs. This is especially handy for mobile apps or integrations that need several pieces of data, reducing the round-trip latency, which typically ranges between 50 and 200 milliseconds.
Additionally, request collapsing, which prevents redundant queries during traffic spikes, further reduces delays. Together, these asynchronous strategies improve data transfer speeds and set the stage for tackling payload size optimization.
Payload Minimization
Once requests are streamlined, the next step is reducing payload sizes. One way to do this is by letting clients specify exactly which fields they need using query parameters (e.g., ?fields=id,name,price), avoiding unnecessary data transfer.
Compression also plays a huge role in cutting down payload size. Tools like Gzip can shrink text-based responses by 60–75%, while Brotli often achieves even better results - reducing payloads by 70–85% and sometimes making them 20–30% smaller than Gzip. For example, compressing a 45 KB payload down to just 7 KB can save about 405 milliseconds on a 3G connection. To balance the benefits with CPU usage, it’s best to apply compression only to responses larger than 1 KB.
For internal service-to-service communication, binary formats like Protocol Buffers (gRPC) or MessagePack are faster to parse and result in smaller payloads compared to JSON. In batch responses, you can reduce redundancy by referencing shared objects instead of repeating identical information. For large datasets, streaming responses (using chunked transfer encoding or NDJSON) allow clients to start processing data as it arrives, improving Time to First Byte (TTFB).
Using Edge Computing
Edge computing brings API processing closer to users by leveraging nodes located near them, cutting wait times from hundreds of milliseconds to just a few. Content Delivery Networks (CDNs) like Cloudflare or Vercel can cache static and semi-static API responses at these edge nodes, often delivering sub-millisecond response times for cache hits. By reducing network hops, CDNs can save anywhere from 50 to 200 milliseconds of latency.
Beyond caching, edge providers can handle tasks like compression offloading. For instance, Gzip or Brotli compression can be performed at the edge, easing the CPU burden on your origin server and improving TTFB. Advanced cache headers like s-maxage (for CDN-specific cache durations) and stale-while-revalidate (to serve stale content while fetching fresh data) further fine-tune performance. For global applications, edge computing ensures consistent speeds by distributing workloads across regional nodes. To protect sensitive information, use headers like Cache-Control: no-store, no-cache, must-revalidate to prevent user-specific data from being cached at the edge.
Maintaining Performance Over Time
Long-term performance isn’t something you can set and forget. Even the best-optimized APIs can degrade over time as traffic patterns shift, code evolves, and infrastructure changes. To keep things running smoothly, performance monitoring needs to be an ongoing effort, not a one-off task.
Regular Benchmarking and SLO Alerts
Benchmarking is more than just a snapshot of speed - it’s about understanding how performance shifts with every deployment. For example, one B2B SaaS platform saw its p99 latency jump from 1.2 to 4.8 seconds over three months and 45 deployments. By introducing SLO-based alerts (ensuring 99% of requests stayed under 3 seconds) and automated deployment comparisons in their CI/CD pipeline, they pinpointed six deployments that added 400–600 milliseconds each due to missing database indexes. Adding those indexes brought p99 latency down to 900 milliseconds and cut alert volume by 83%.
"Bad benchmarks are worse than no benchmarks because they give you false confidence." - Zoyla
When setting benchmarks, don’t skip the warm-up phase. Allow the system to run for 1–2 minutes to account for JIT compilation and cache warming, then discard those early results. Use percentiles rather than averages to catch tail latency - after all, a p50 of 100 milliseconds can easily hide a p99 of 8 seconds, leaving 1% of users stuck with frustrating delays. Also, set alerts when resource usage hits 70% saturation, giving you time to address issues before hitting critical thresholds. Keep in mind that a 99.9% SLA allows for just 43 minutes of downtime per month.
This kind of proactive benchmarking lays the groundwork for spotting and addressing performance issues early.
Continuous Profiling
Regular profiling cycles are essential for catching new bottlenecks as your codebase grows. Memory leaks, inefficient loops, or unindexed database queries can creep in as features and business logic evolve. For stable systems, run CPU profiling monthly; for fast-changing ones, weekly is better. Tools like v8-profiler-next can help streamline this process.
To keep your monitoring tools efficient, standardize dynamic endpoint paths by replacing variables with placeholders (e.g., /api/users/123 becomes /api/users/{id}). This prevents unnecessary data storage and keeps costs under control. Focus on tracking the "four golden signals": Latency (response times), Traffic (throughput), Errors (failure rates), and Saturation (resource usage). Together, these metrics provide a full picture of system health, helping you identify and address problems before they affect users.
By committing to regular profiling, you can stay ahead of inefficiencies and adapt to your system’s evolving needs.
Adapting to Changing Requirements
As your business grows, so do your performance targets. Review your SLOs every quarter and adjust error budgets to strike the right balance between rolling out new features and maintaining stability. For growing datasets, consider switching from offset/limit pagination to cursor-based pagination to improve performance. Adding circuit breakers for external service calls can also prevent failures from spreading throughout your API.
This kind of adaptability helps you avoid two common pitfalls: over-optimizing too early or waiting until performance problems become a crisis. Even a small 100-millisecond increase in API response time can lead to a 7% drop in conversion rates and a 4% rise in user churn. Staying flexible and proactive ensures your system remains reliable and responsive as demands change.
Conclusion
Summary of Optimization Strategies
Creating faster APIs requires a blend of smart techniques. Caching - using tools like Redis, CDNs, or in-memory stores - is a cornerstone. As Nawaz Dhandala from OneUptime aptly says:
The fastest API call is the one you never have to make. The second fastest is the one that hits a cache. Everything else requires careful optimization.
Reducing latency through indexing and addressing N+1 query issues is another critical step. Connection pooling helps by cutting down on repeated handshake delays, which are a common bottleneck. Infrastructure tweaks like compression, asynchronous processing, and edge computing round out the toolkit. These strategies, when combined, ensure your API performs well even under heavy load.
Beyond the technical improvements, these optimizations directly impact business performance.
Long-Term Benefits of Faster APIs
Faster APIs don't just improve performance - they drive measurable business outcomes. For example, websites that load in one second see conversion rates three times higher than those that take five seconds. In marketing, low-latency APIs enable real-time personalization that feels seamless, ensure campaign data syncs without hiccups, and reduce user frustration during form submissions or checkout processes.
The financial impact is hard to ignore. Amazon discovered that adding just 100 milliseconds to load times led to a 1% drop in revenue. Optimized APIs also lower operational costs by reducing server and database strain, build user trust through consistent reliability, and prepare your system to handle surges in traffic during key moments like launches or seasonal events. Investing in API performance today sets the stage for a scalable, future-ready business.
For email marketers, fast APIs are essential for delivering timely campaigns, a critical factor for success in the Email Service Business Directory.
FAQs
What’s a good P95 or P99 latency target for my API?
When setting latency targets, the right benchmarks depend on what your application requires. For most user-facing systems, a P95 latency of less than 200ms and a P99 latency of under 1 second are solid goals. These thresholds are commonly used to deliver a smooth experience, meeting both user expectations and general performance standards.
How can I identify the bottleneck causing high API latency?
To figure out what's causing high API latency, start by measuring response times at different levels: external services, database queries, and server-side processing. Set clear baselines to identify delays and determine exactly where they happen. Leverage monitoring tools and profiling methods to zero in on specific problems like sluggish database queries, network delays, or inefficiencies in server processing. This kind of focused analysis ensures your optimization efforts are aimed at the right areas.
When should I use caching vs database optimization vs edge computing?
The best approach depends on your specific challenges and needs. Caching helps by storing data closer to users, reducing the need to repeatedly fetch the same information. Database optimization tackles slow queries or indexing issues, speeding up server-side processes. Meanwhile, edge computing addresses delays caused by distance, processing data near users to cut down on latency. Many times, these methods are used together to tackle various sources of delay effectively.