Email engagement benchmarks help you analyze your performance by comparing metrics like open rates, click-through rates (CTR), and unsubscribe rates to industry standards. This process removes guesswork, highlights areas for improvement, and ensures your campaigns are on track to meet audience expectations. Here's what you need to know:
- Core Metrics: Focus on open rate, CTR, click-to-open rate (CTOR), and unsubscribe rate. CTOR is now the most reliable indicator of content performance due to privacy changes, like Apple Mail Privacy Protection.
- Industry-Specific Context: Engagement varies widely by industry. For example, e-commerce averages a 32.67% open rate, while non-profits hit 52.38%. Always compare against your specific industry.
- Data Preparation: Clean your data, remove outliers, and separate automated flows from manual campaigns to avoid skewed results.
- Reliable Sources: Use benchmark reports from platforms like Klaviyo, MailerLite, and ActiveCampaign for accurate insights.
- Actionable Insights: Low open rates may point to deliverability issues, while low CTOR suggests content misalignment. Address these gaps strategically.
Key Takeaway: Regular benchmarking ensures your email strategy stays effective, improves ROI, and aligns with industry trends.
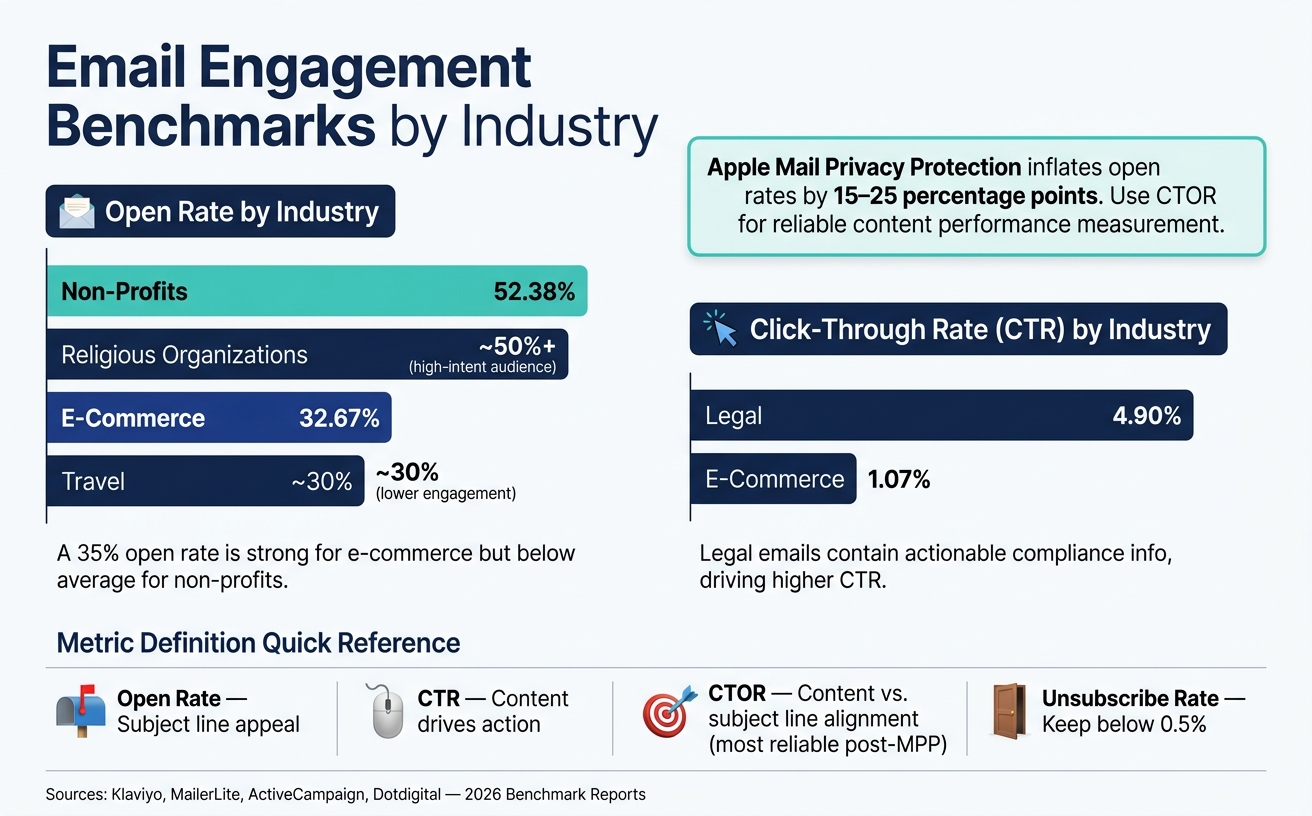
Email Engagement Benchmarks by Industry: Key Metrics Compared
Email Marketing Benchmarks Explained: Why Your Open Rates Don’t Define Your Success
sbb-itb-6e7333f
Key Email Engagement Metrics You Need to Know
Benchmarking starts by identifying the right email marketing platform and metrics and understanding how to calculate them.
Core Engagement Metrics to Track
When it comes to email performance, four metrics stand out: open rate, click-through rate (CTR), click-to-open rate (CTOR), and unsubscribe rate. Here's a breakdown of what they measure and how to calculate them:
| Metric | Formula | What It Tells You |
|---|---|---|
| Open Rate | (Total Opens ÷ Total Recipients) × 100 | How appealing your subject line is and how recognizable your sender name appears |
| Click-Through Rate (CTR) | (Total Clicks ÷ Total Recipients) × 100 | Whether your email content motivates recipients to take action |
| Click-to-Open Rate (CTOR) | (Unique Clicks ÷ Unique Opens) × 100 | The effectiveness of your email content and call-to-action |
| Unsubscribe Rate | (Total Unsubscribes ÷ Total Recipients) × 100 | Whether your content aligns with audience expectations or if disengagement is creeping in |
Among these, CTOR has become the most reliable indicator of content performance. This shift comes in response to Apple Mail Privacy Protection, which inflates open rates by 15–25 percentage points due to pre-fetching tracking pixels.
As Erin McInrue Savage from ActiveCampaign puts it:
"Knowing where you stand against industry standards isn't just about vanity metrics - it's about understanding if your message is actually landing."
When it comes to unsubscribe rates, aim to stay below 0.5%. A rate exceeding 1.0% can lead to deliverability issues within 60–90 days.
Secondary Metrics That Affect Engagement
Beyond the core metrics, bounce rate and deliverability play crucial roles in shaping your email performance.
-
Bounce Rate: A bounce rate higher than 2% often signals problems like list quality or sender reputation. Bounces are categorized as either:
- Hard Bounces: Permanent issues, such as invalid email addresses, which should be removed immediately.
- Soft Bounces: Temporary problems, like full inboxes, which should be addressed after three consecutive failures.
- Deliverability: This hidden factor impacts all your metrics. For example, Gmail's primary inbox placement dropped to 53.70% in 2026, meaning nearly half of marketing emails bypassed the main inbox. If your open rates are slipping despite consistent content, deliverability is often the culprit.
How Industry Type Shapes Benchmark Expectations
Engagement metrics vary widely by industry, so context is everything. For instance, a 35% open rate is a strong result for an e-commerce brand, which averages 32.67%, but it falls short for non-profits, where the average is 52.38%.
"Comparing yourself to the overall average will either give you false confidence or unnecessary panic." - SaaS Scored
The reason for these differences often ties back to subscriber intent. Non-profits and religious organizations typically attract highly motivated audiences, leading to higher open and click rates. On the other hand, industries like e-commerce and travel, which rely on larger, less engaged lists and frequent sends, see diluted engagement percentages. Content type also plays a role - legal emails, often containing actionable compliance information, lead CTR benchmarks at 4.90%, while e-commerce lags at 1.07%.
To truly understand your performance, compare your metrics to industry-specific benchmarks rather than broad averages. This approach ensures you're evaluating your campaigns in the right context and setting realistic goals. Recognizing these variations is essential before diving into your email campaign analysis.
How to Prepare Your Email Data for Benchmarking
Before diving into comparisons with industry benchmarks, it’s crucial to clean and organize your internal data. Skipping this step can lead to misleading insights and poor decision-making.
Choosing the Right Timeframe
Start by selecting a timeframe that reflects your current audience and strategy. A window of 3 to 6 months works well - it smooths out any one-off spikes while staying relevant. Be sure to remove outliers to keep your averages accurate.
Seasonality is another key factor. Industries with strong seasonal trends, like retail, can see significant shifts during specific periods. For example, Black Friday can push click rates from a standard 1.5% to as high as 13%. To capture a more reliable picture of trends, consider comparing six-month blocks, especially if your business experiences these fluctuations.
"Benchmarks aren't goals. They're diagnostic tools. The real question isn't 'How do we compare to the industry average?' It's 'What do these numbers tell us about our performance in our specific context?'" - Nick Donaldson, Senior Director of Growth, Knak
Once your timeframe is set, the next step is organizing your campaign data.
Organizing Your Campaign Metrics
After determining your timeframe, separate automated email flows from manual campaigns. Why? Automated emails, like welcome series or abandoned cart reminders, consistently outperform manual campaigns. For instance, automated flows typically achieve a click rate of 5.58%, compared to just 1.69% for manual campaigns. They also generate significantly higher revenue per recipient - $1.94 versus $0.11, a difference of 17.6 times. Mixing these data sets can inflate your averages and obscure real performance.
Within manual campaigns, group emails by type - newsletters, promotional offers, and transactional emails - since each has its own performance characteristics.
Segmenting by Audience and Email Type
Once your campaign metrics are organized, segmentation can provide even deeper insights. For example, if your overall open rate is low, it might be due to a segment of inactive subscribers rather than your engaged audience. Separating new subscribers from long-term contacts allows you to benchmark each group more effectively.
Geography and device type also play a role in email performance. Mobile devices account for 47% to 60% of email opens, but desktop users often show stronger conversion rates. Regional differences matter too - a 19% open rate is common in Asia-Pacific, while Oceania averages exceed 46%. Without accounting for these factors, relying on a single global average could lead to distorted conclusions about your performance.
Where to Find Reliable Industry Benchmarks
Once your data is organized and segmented, the next step is identifying benchmarks that are worth your time. The key is to focus on reports that break down data by industry, email type, and region, while also using a clear and transparent methodology.
Trusted Benchmark Reports and Tools
Some of the most reliable benchmark data comes directly from major email service providers. These companies aggregate performance metrics from thousands of real-world campaigns, making their insights particularly valuable. For 2026, here are some standout sources:
- Klaviyo: Pulls data from over 183,000 brands, with a strong focus on ecommerce. Their reports cover metrics like revenue per recipient and flow performance.
- Dotdigital: Analyzes more than 10 billion campaigns across 43 industries and regions, offering a global perspective.
- MailerLite: Provides insights from 3.6 million campaigns, catering to small businesses and creators across 24+ industries.
- ActiveCampaign: Specializes in deliverability-adjusted benchmarks, which are particularly useful for understanding inbox placement.
- 42 Agency: Focuses on B2B-specific benchmarks, drawing from over 500 million emails in sectors like SaaS, FinTech, and Healthcare Tech.
Keep in mind that open rates can be misleading due to Apple Mail Privacy Protection, which is estimated to inflate figures by 15–20 percentage points. Open rates are best used for comparing performance between industries rather than as absolute targets. For a more reliable metric, focus on CTOR (Click-to-Open Rate), which reflects actual user engagement.
"Open rates across all tables are inflated by Apple Mail Privacy Protection (49% of opens) by an estimated 15–20 percentage points. Use them for relative comparison between industries, not as absolute performance targets." - Geysera Editorial Team
In addition to these reports, your email platform may offer built-in tools to help you benchmark directly against similar senders.
Using Built-In Benchmarking Features in Your Email Platform
Many email platforms now include benchmarking tools right in their dashboards. These features allow you to compare your performance with similar senders in your industry, providing a more accurate evaluation.
For example:
- ActiveCampaign offers an Email Performance Calculator where you can input your metrics and see how you compare to others in your field.
- Omnisend includes an interactive calculator that automatically generates comparisons for your campaigns.
These tools are particularly useful because they provide an "apples-to-apples" comparison, helping you understand where you stand in a specific context. If your current platform lacks these features, it might be worth considering when choosing your next email service provider.
Using the Email Service Business Directory to Find the Right Platform
If you're searching for a platform with robust benchmarking tools, the Email Service Business Directory can be a valuable resource. This curated directory allows you to filter email marketing platforms based on your specific needs, such as analytics capabilities, automation features, and industry focus.
This tool simplifies the process of comparing providers, helping you find the one that aligns best with your benchmarking and campaign objectives.
How to Compare Your Metrics to Industry Standards
Once your data is neatly organized, the next step is to measure it against industry standards. A common mistake marketers make isn’t bad math - it’s comparing metrics that don’t align. To avoid this, ensure your definitions are consistent before calculating any performance gaps.
Making Sure Your Metrics Are Defined Consistently
Before you stack your numbers against benchmarks, double-check that both are calculated the same way. This step is often overlooked but can make a huge difference. Take Click-Through Rate (CTR) as an example: some calculate it as clicks divided by total emails sent, while others divide clicks by emails delivered (excluding bounces). These subtle differences can lead to wildly different results.
Here’s a quick look at where definitions often vary:
| Metric | Standard Definition | Common Variation |
|---|---|---|
| Open Rate | Unique opens / Total recipients | Total opens (includes multiple opens per user) |
| CTR | Clicks / Total emails sent | Clicks / Delivered emails |
| Unsubscribe Rate | Unsubscribes / Total recipients | Unsubscribes / Total opens |
| Bounce Rate | Undelivered emails / Total emails sent | Hard bounces only vs. hard + soft bounces |
To make a fair comparison, stick to evaluating campaigns of similar types and definitions.
"Picking which benchmarks to use is, unfortunately, often a subjective decision." - Margaret Ngai, Chief Technology Officer, Response Innovations
Stick with one benchmark report for all your metrics. Don’t mix data from different sources, like pulling open rates from one report and CTR from another.
Calculating the Gap Between Your Results and Industry Averages
Once your definitions are aligned, you can calculate the performance gap. Subtract the industry average from your metric to see where you stand. A positive result means you're doing better than the benchmark, while a negative number highlights areas for improvement.
For instance, if your retail email CTR is 1.6% and the industry average is 2.0%, your gap is −0.4 percentage points. This gives you a clear, actionable figure to work with. Tracking these gaps in a simple spreadsheet - with columns for your metric, the benchmark, and the difference - helps you focus on the areas that need the most attention.
When selecting benchmarks, industry-specific data always trumps general averages. For example, a nonprofit with a 20% open rate might seem weak compared to a global average of 39.26%. But when measured against nonprofit-specific benchmarks, it’s actually performing as expected.
Understanding What Performance Gaps Tell You
Each performance gap sheds light on a different aspect of your email strategy. A low open rate compared to your industry could point to deliverability issues, a poor sender reputation, or subject lines that fail to grab attention. On the other hand, a low CTR with a normal open rate might suggest that your content or call-to-action isn’t engaging enough - people open the email but don’t take the next step.
One of the most revealing metrics is CTOR (Click-to-Open Rate). Unlike CTR or open rate, CTOR ignores deliverability issues and zeroes in on whether your content matched the promise of your subject line. A low CTOR alongside a healthy open rate usually signals a disconnect between your message and your audience.
Be cautious with open rates that far exceed industry averages. They might be inflated by Apple Mail Privacy Protection (MPP), which can add 15–20 percentage points to reported open rates. Metrics like CTOR and CTR are far less affected by MPP and provide a more accurate picture of audience engagement. By identifying these gaps, you can fine-tune your email strategy and make targeted improvements.
"Your marketing only improves when you know what to measure and act on the insights." - Duncan Elder, Content Writer, MailerLite
Setting Goals and Acting on Your Benchmarking Results
Once you've pinpointed performance gaps, it's time to take action. Benchmarking only delivers value when you use it to decide which metrics to tackle first. With the gaps identified, the next steps involve setting clear targets and refining your campaigns.
Deciding Which Metrics to Improve First
Start with the metrics that have the biggest impact. Deliverability should be your top priority. If your emails aren’t landing in inboxes, metrics like open rates and click rates become irrelevant. Ensure your SPF, DKIM, and DMARC authentication are correctly configured - this is the foundation for all other improvements.
Once deliverability is solid, focus on fixing below-average open rates. Low open rates often point to issues with subject lines, sender reputation, or list hygiene. After stabilizing open rates, shift your attention to CTOR (click-to-open rate) and click rates, which measure how well your content resonates with your audience.
Don’t overlook automated flows. Even though they make up a smaller portion of your total sends, they generate a disproportionately high share of revenue.
"The gap between average and top 10% is enormous - top performers earn 9x more RPR per campaign. Improving from average to top 10% is worth more than any industry switch." - Bob Thordarson, CEO, Geysera
Setting Realistic Performance Targets Using Benchmarks
Industry benchmarks act as a starting point, not the final goal. Use them to identify areas where you're lagging, but base your targets on your own data. For example, if your open rate has improved from 22% to 26% over six months, aim for 28–29% next - not the industry average of 31.4%.
When setting targets, treat automated flows and standard campaigns separately. Flows consistently outperform campaigns across all metrics - a 5.58% click rate for flows versus 1.69% for campaigns. Combining them into one target could lead to unrealistic goals. Also, factor in Apple Mail Privacy Protection (MPP) when working with open rate targets. Since MPP impacts about 49% of opens, rely more on CTOR and CTR for accurate performance tracking.
With realistic targets in place, the next step is fine-tuning your campaigns using proven techniques.
Optimizing Campaigns and Choosing the Right Tools
Closing performance gaps requires a mix of targeted testing and personalization. For open rates, start with A/B testing subject lines. AI-assisted subject line testing alone can drive a 22% increase. Once open rates improve, focus on click rate issues by experimenting with CTA placement, copy, and offer structure.
Personalization also plays a key role. AI-powered product recommendations can boost click rates to an average of 3.75%, with top performers reaching as high as 8.79%. Upgrading to platforms that offer built-in A/B testing, flow automation, and AI-driven personalization is essential for driving these improvements.
If you're looking for tools to support these efforts, the Email Service Business Directory is a great resource. Whether you need advanced ecommerce automation, B2B CRM integration, or detailed analytics, this directory can help you find the right platform to match your goals.
Conclusion: Using Benchmarks to Keep Improving Over Time
Benchmarking isn’t something you do once and forget. Email performance is constantly evolving. Changes like inbox algorithms, privacy updates (looking at you, Apple Mail Privacy Protection), and shifting consumer habits can all throw your previous benchmarks off course. A good example? Gmail’s primary inbox placement rate dropped from 58.72% in early 2024 to 53.7% in 2026. What worked six months ago might not cut it today.
The smartest move? Make benchmarking a quarterly routine. Every three months, review your key metrics. Start by comparing them to your own past performance, then stack them up against the latest industry data. This habit helps you spot whether your performance gaps are closing or widening - and points you toward the areas that need the most attention.
"The best benchmark is always: Are we getting better at reaching our audience, communicating effectively, and driving outcomes that matter?" - Nick Donaldson, Senior Director of Growth, Knak
As you refine this process, focus on metrics that directly impact your business. For example, Revenue Per Recipient (RPR) and click-to-open rate (CTOR) are much more reliable than open rates, especially with privacy features muddying the waters. Automated flows, in particular, are worth a closer look - they generate up to 17.6x more revenue per recipient than standard campaigns. These flows should have their own benchmarks, separate from your one-off broadcast emails.
FAQs
How do I pick the right benchmark for my exact industry?
Start by taking a close look at your internal email engagement data. This includes details about your audience, the type of content you’re sending, and the overall health of your email list. These insights offer the most meaningful context for evaluating your campaigns.
Next, compare your performance to external industry benchmarks. Look for reports that match your business model - whether you're B2B or B2C - as well as your region and the type of campaign you’re running (like promotional or transactional emails). For an extra boost, the Email Service Business Directory is a great resource for finding tools and providers to help fine-tune your campaigns.
What should I use instead of open rate after Apple MPP?
With Apple Mail Privacy Protection (MPP) making open rates less dependable, it's time to shift your attention to metrics that truly reflect user engagement. Focus on click-through rates, reply rates, conversion rates, and revenue per recipient - these provide a clearer picture of how your audience is interacting with your emails.
While open rates can still serve as a general health check, such as identifying potential deliverability issues, they shouldn't be your primary metric. Instead, redefine your engaged audience segments based on actions like clicks, replies, or purchases. This approach ensures you're measuring what really matters: genuine customer behavior and the value they bring to your business.
How do I benchmark flows vs. one-off campaigns separately?
To evaluate flows and one-off campaigns effectively, it's important to analyze them separately, as their objectives and performance metrics vary. Begin by examining email data from the past 90 days, organizing it by campaign type.
Flows, such as welcome series or cart abandonment sequences, typically show higher engagement rates compared to one-off campaigns like newsletters. To gain meaningful insights, compare the metrics of each type to relevant industry benchmarks within their specific category.