When managing marketing campaigns across multiple channels, integrating analytics is the key to understanding performance and improving ROI. This article highlights the best platforms for cross-channel analytics, focusing on their features, integrations, and scalability. Here's what you need to know:
Key Insights:
- Google Analytics 4 (GA4): Ideal for tracking web and mobile activity with advanced attribution models and predictive analytics.
- Adobe Analytics: Designed for enterprises, offering unsampled data, identity stitching, and multi-touch attribution.
- Amplitude: Specializes in user behavior tracking, with tools for predictive analytics and real-time segmentation.
- HubSpot: Combines CRM and marketing data, offering multi-channel attribution and customer journey tracking.
- Improvado: Simplifies data integration across 500+ sources, automating ETL processes for consistent reporting.
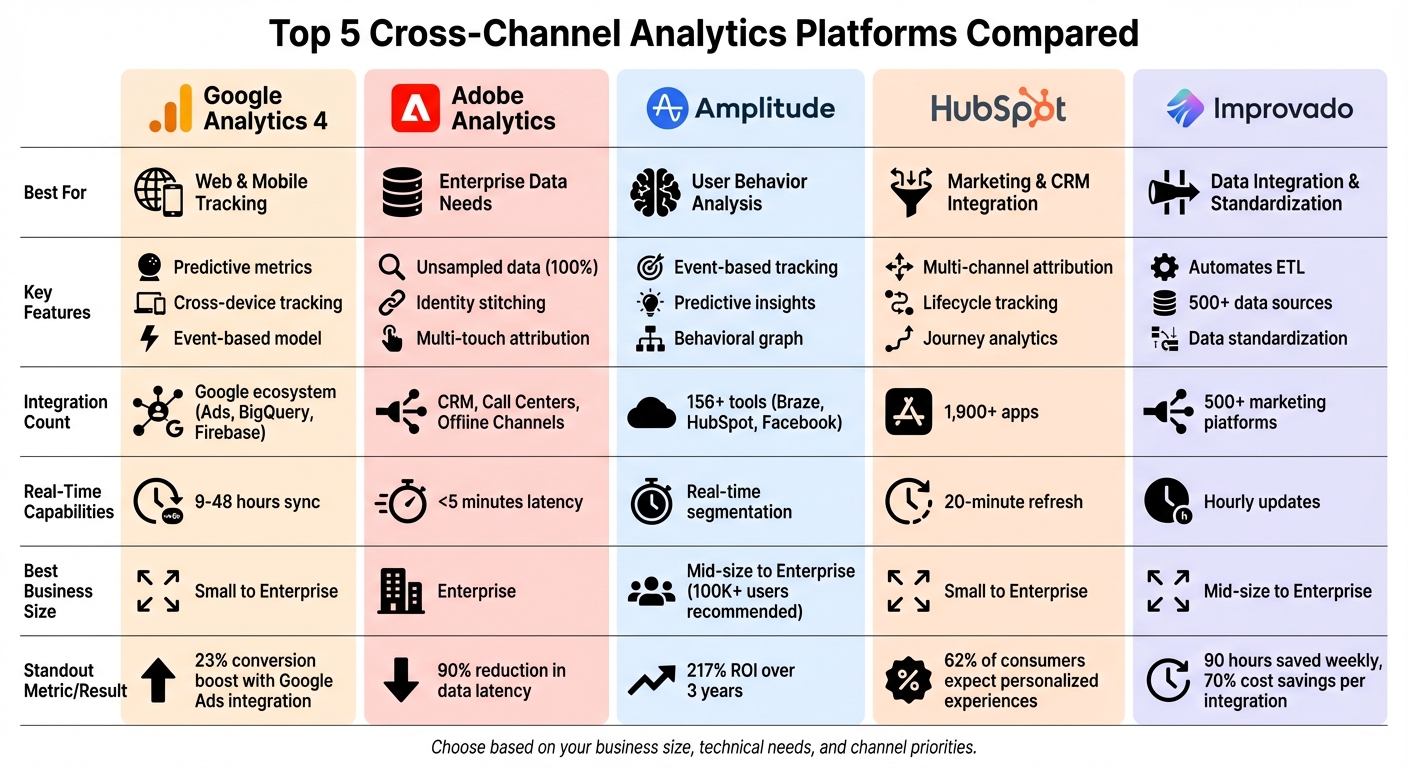
Quick Comparison:
| Platform | Best For | Key Features | Integration Options |
|---|---|---|---|
| Google Analytics 4 | Web & Mobile Tracking | Predictive metrics, cross-device tracking | Google Ads, BigQuery, Firebase |
| Adobe Analytics | Enterprise Data Needs | Unsampled data, identity stitching | CRM, Call Centers, Offline Channels |
| Amplitude | User Behavior Analysis | Event-based tracking, predictive insights | 156+ tools (Braze, HubSpot, Facebook) |
| HubSpot | Marketing & CRM Integration | Multi-channel attribution, lifecycle tracking | 1,900+ apps (CRM, Social, Ads) |
| Improvado | Data Integration & Standardization | Automates ETL, 500+ data sources | BigQuery, Snowflake, Redshift |
Each platform offers distinct strengths, from GA4's predictive analytics to Improvado's automated data management. Choose based on your business size, technical needs, and channel priorities.
Cross-Channel Analytics Platforms Comparison: Features, Integrations, and Best Use Cases
Cross-platform measurement and attribution
sbb-itb-6e7333f
Google Analytics 4: Multi-Platform Tracking
Google Analytics 4 (GA4) brings a fresh approach to tracking by seamlessly monitoring users across websites and mobile apps using an event-based model. Every interaction - whether it’s a click, page view, or app open - is logged as an individual event. This ensures consistent tracking across platforms like desktop, iOS, and Android. GA4 combines data from web and mobile into a single property: websites integrate using the Google Tag or Tag Manager, while mobile apps connect through the Firebase SDK. Cross-device tracking relies on three identity methods: User-ID (for logged-in users), Google Signals (for users signed into their Google accounts), and Device ID. Together, these tools create a cohesive view of user behavior across devices.
To address data gaps caused by cookie restrictions, GA4 employs machine learning. Conversion modeling estimates missing data when cookies are unavailable or users opt out. Additionally, its data-driven attribution assigns credit to multiple touchpoints - like social media, email, and search - based on their role in driving conversions.
Rafael Campoamor, a digital marketing freelancer, notes, "GA4 Attribution goes beyond traditional tracking by offering a nuanced view of how each marketing channel contributes to the customer journey".
These advanced tracking tools set the foundation for GA4's extensive feature set.
Main Features of Google Analytics 4
GA4 organizes event tracking into four main categories:
- Automatically collected events: Includes actions like
first_visitandsession_start. - Enhanced measurement events: Tracks activities such as scrolls, file downloads, and video engagement.
- Recommended events: Covers user actions like
purchase,login, andsign_up. - Custom events: Allows businesses to define events tailored to their specific goals.
GA4’s predictive analytics, powered by Google’s AI, calculates key metrics like churn probability, purchase likelihood, and estimated revenue. These insights help businesses create predictive audiences for remarketing in Google Ads. To run Display campaigns, audiences need at least 100 users, while Search campaigns require a minimum of 1,000 users.
A real-world example comes from Gymshark, a UK-based fitness brand. In 2023, they used GA4 to track their ecommerce website and mobile app. By analyzing the customer journey, Gymshark reduced checkout drop-offs by 9% and increased clicks on product pages by 5%.
Integration with Google Tools
GA4’s deep integration with Google’s ecosystem enhances campaign performance. Key events (formerly known as conversions) can be imported directly into Google Ads, enabling Smart Bidding across devices and sessions. This integration allows businesses to use GA4-created audiences for remarketing and provides a unified dashboard to track metrics like Return on Ad Spend (ROAS) and Cost Per Acquisition (CPA). Auto-tagging with gclid ensures precise attribution for Google Ads campaigns, with data typically syncing within 24 to 48 hours - or as quickly as 9 hours for near real-time updates.
Google reports that businesses linking their Google Ads or Google Marketing Platform accounts to GA4 see an average 23% boost in conversions and a 10% drop in cost per conversion.
Steve Ganem, Director of Product Management at Google Analytics, states, "Our long-term vision is to give you a truly unified and simplified measurement experience that will enable you to confidently make advertising budget decisions".
For advanced users, the BigQuery Export feature allows raw GA4 data to be transferred into a data warehouse, making it easier to integrate analytics with other business datasets.
Best Fit for Different Business Sizes
GA4’s flexibility makes it suitable for businesses of all sizes:
- Small businesses: Benefit from automatic tracking and enhanced measurement tools.
- Mid-sized companies: Can optimize ad spend using predictive audiences and Google Ads integration.
- Enterprise organizations: Gain value from features like BigQuery Export and custom event tracking to develop advanced data pipelines.
GA4 also supports features like Google Signals for cross-device remarketing, User-ID for businesses with login systems, and Measurement Protocol for tracking server-side or offline events. With the ability to consolidate up to 100 properties under one account, it’s adaptable to various business models. Its lifecycle reporting framework - spanning Acquisition, Engagement, Monetization, and Retention - helps teams identify user drop-off points and determine which channels drive the most impactful actions.
Adobe Analytics for Large-Scale Operations
Adobe Analytics takes multi-platform tracking to the next level, catering specifically to the needs of large-scale enterprises with complex, global data requirements.
This platform is built to process enormous amounts of data - billions of points in milliseconds - delivering customer-level insights that are essential for businesses managing multiple brands and diverse marketing channels. Unlike many analytics tools that rely on data sampling, Adobe Analytics ensures 100% unsampled data, providing unmatched accuracy.
One standout feature is its identity stitching capability, which merges online and offline data into a single customer profile. This includes unifying customer IDs, traits, and behaviors across platforms like web, mobile, email, call centers, and even point-of-sale systems. Enterprise users have reported a 90% reduction in data latency and 62% more personalized campaigns as a result.
Karen Hopkins, Global CMO at EY, highlights: "I've always had a vision of looking at marketing data more holistically from an account perspective - not an easy task when dealing with global clients and organizations. Adobe solutions work together to help us connect teams and find more proactive ways to work with clients".
For B2B organizations, the platform offers a specialized B2B Edition, which includes features like account-level analysis and attribution for buying groups. Additionally, its patented data governance framework ensures secure data management with role-based permissions and automated alerts.
Advanced Analysis Tools
Adobe Analytics brings advanced tools to the table, powered by machine learning. Its machine learning–driven attribution dynamically assigns credit across campaigns based on unique data patterns. With the Attribution IQ feature, teams can easily compare various attribution models - such as first touch, last touch, linear, U-shape, J-curve, and time decay - all within a single interface. This eliminates the guesswork in determining which channels contribute the most value.
The platform also offers retroactive segmentation, allowing users to update data views instantly without reprocessing. This flexibility is invaluable when business questions shift or errors are identified, as it avoids the need for lengthy IT interventions. AI-accelerated discovery further enhances analysis by automatically detecting anomalies and surfacing key trends, enabling faster identification of critical customer segments.
Behavior-based audience creation goes deeper than just demographics. It builds rich segments based on historical and real-time behaviors, as well as campaign interactions. Participation models take this a step further by identifying which specific touchpoints drive conversions, providing a complete view of the customer journey with multi-touch attribution.
These tools are seamlessly integrated into Adobe's framework, which connects data from various sources to provide a unified analytical experience.
Integration Options
Adobe Customer Journey Analytics (CJA) integrates online and offline datasets via the Adobe Experience Platform, enabling connections to virtually any data source. Through its integration with Adobe Campaign, users can track email marketing metrics - like sent, delivered, clicked, and opened - alongside web and social analytics. The platform also supports third-party data through the Experience Platform Web SDK, APIs, and connectors for cloud solutions like Snowflake, BigQuery, and Amazon S3.
With data latency of less than five minutes, Adobe Analytics delivers real-time insights. These insights can feed directly into Adobe Real-Time CDP and Adobe Journey Optimizer, enabling personalized customer interactions.
Bryan Hooper, Senior Vice President of Digital and Consumer Technology at Subway, shares: "We've been able to take this rich set of data that we've built about guests on our platforms and really activate that into our marketing channels with personalized emails and push notifications".
The integration with Adobe Campaign has led to impressive results, such as a 30% reduction in time-to-market for email campaigns. Some companies have even achieved a 127% increase in annual booked accounts through the combined power of integrated campaign and analytics management. Adobe Analytics is available across four contract tiers - Ultimate, Prime, Select, and Foundation. Pricing details can be obtained by contacting the Adobe Account Team.
Amplitude: User Behavior Tracking
Amplitude specializes in product intelligence, helping businesses understand not just what users do, but why they do it. Trusted by over 11,000 digital products, Amplitude has earned recognition as a Leader in the Forrester Wave™: Digital Analytics Solutions, Q3 2025.
The platform uses an event-based tracking model, meaning every user action - whether it’s a click, page view, or purchase - is tied to an individual. This approach creates a detailed activity history across web, iOS, and Android platforms. Amplitude's identity resolution system connects cookies, device IDs, and user IDs, ensuring users aren’t double-counted as they switch between devices like smartphones, tablets, and laptops.
"We use Amplitude to track top line metrics, but the real power of it is going deep", says Alex Tew, CEO of Calm.
One standout feature is its retroactive channel classifiers. For example, when you define acquisition channels using UTM and referrer data, updating the definition - like adding a new social domain - automatically updates historical charts. This eliminates the need to re-instrument code, saving time when new marketing channels emerge.
Amplitude also empowers teams to group users based on behaviors, such as repeatedly viewing pricing pages or using discount codes. This is made possible by the Behavioral Graph (Nova Engine), which performs real-time joins across users, events, and attributes. Businesses using Amplitude report a 217% ROI over three years, with an average payback period of just six months.
Its focus on product tracking extends to seamless integration with email and social media analytics, aligning with a unified strategy for data-driven decision-making.
Behavior Tracking Features
Amplitude’s event-based tracking provides deep insights into user journeys, making it an invaluable tool for cross-channel performance measurement.
The platform excels at mapping the entire customer journey, from the first interaction to conversion. It identifies which marketing channels deliver the most value using first-touch and last-touch attribution models.
Take Instacart, for instance. Their growth team used Amplitude’s cross-platform analytics to analyze user behavior during signup and activation funnels on both web and mobile. By pinpointing friction points on their desktop landing page and conducting A/B tests, they boosted landing page conversions by 10%.
Another noteworthy feature is the Compass tool, which identifies "aha moments" - specific actions that predict long-term user retention. Instead of guessing which features matter most, Compass analyzes correlations between behaviors and retention, showing which cross-channel features drive loyalty.
TicketSwap, a ticketing platform in Europe, utilized behavioral analytics to detect users encountering technical issues during purchases. By syncing this segment to paid social and CRM systems in real time, they launched a targeted campaign that increased sales funnel completion by 15%.
For added depth, Amplitude’s Session Replay feature allows teams to watch recordings of user interactions. This makes it easier to understand the context behind behavioral patterns and spot issues that raw data might overlook.
Predictive Analytics Tools
Amplitude also uses machine learning to predict future user behaviors. Its transformer-based AI model processes hundreds of behavioral signals - like event frequency, user attributes, and activity patterns - to assign probabilistic scores to each user.
With future-state segmentation, users can be grouped based on their likelihood to take specific actions, such as making a purchase or canceling a subscription. Unlike traditional cohorts that analyze past behavior, these predictive segments allow businesses to intervene proactively. These predictions can lead to performance improvements of 5% to 20% compared to standard behavioral cohorts.
For example, Rappi, a delivery service, created behavioral cohorts of new users through real-time audience syncing. By delivering tailored onboarding messages across push notifications, emails, and in-app channels, they cut customer acquisition costs by 30%.
Amplitude’s predictive segments integrate seamlessly with over 156 tools, including marketing automation platforms like Braze, Iterable, HubSpot, and Mailchimp, as well as ad networks like Facebook Ads, Google Ads, and TikTok Ads. This ensures that insights can be activated across your entire marketing ecosystem. For instance, users flagged as "at risk of churn" can automatically trigger retention campaigns across email, push notifications, and paid ads - no manual effort required.
For businesses just starting out, Amplitude offers a free plan that tracks up to 10,000 monthly users, making it an accessible entry point for product analytics. However, to ensure predictions are statistically accurate, the platform recommends having at least 100,000 monthly active users.
HubSpot: Combined Marketing and CRM Analytics

HubSpot brings together CRM and marketing data on one platform, combining email, social media, paid ads, and organic data into unified dashboards. This setup eliminates data silos, making it easier to deliver the personalized experiences that 62% of consumers expect. It connects every interaction - like email clicks or social media engagements - to CRM objects such as contacts, deals, and revenue. This connection is essential for aligning insights across email and social channels, a cornerstone of effective cross-channel analytics.
With customer journey analytics, HubSpot provides a clear picture of how contacts move through lifecycle stages, tracking conversion rates from Lead to Marketing Qualified Lead (MQL), Sales Qualified Lead (SQL), and eventually to Customer. HubSpot Data Sync ensures customer data stays up to date by checking for changes in connected apps every five minutes. Additionally, analytics data refreshes as often as every 20 minutes, giving teams access to insights that are nearly real-time.
Multi-Channel Attribution
HubSpot's attribution reporting assigns monetary value to marketing efforts by analyzing interactions throughout the customer journey, from initial awareness to closed revenue. The platform offers three attribution report types, reflecting different stages of the sales funnel: Contact Create (top), Deal Create (middle), and Revenue Attribution (bottom).
"Attribution surfaces which interactions a person or group of people took along their journey toward a desired outcome or 'conversion' point", says the HubSpot Product Team.
Users can switch between multiple attribution models - like First-touch, Last-touch, Linear, U-shaped, W-shaped, or Time Decay - to better understand each channel's role [57,58]. For instance, a First-touch model might show that organic search is effective for initial awareness, while a W-shaped model could highlight the importance of email campaigns in moving leads from MQL to SQL.
The platform tracks detailed interaction data, including UTM parameters, ad keywords, CTAs, social posts, and asset types like landing pages or emails. This level of detail helps teams identify which assets drive the most leads and revenue, enabling smarter decisions about resource allocation. For example, Contact Create attribution reports focus on top-of-funnel efforts that generate new leads, while Revenue Attribution reports (available with Marketing Hub Enterprise) emphasize the assets that play a key role in closing deals.
| Report Type | Primary Metric Measured | Subscription Level Required |
|---|---|---|
| Contact Create Attribution | Marketing efforts resulting in new contacts | Professional, Enterprise |
| Deal Create Attribution | Marketing efforts resulting in new deals | Enterprise |
| Revenue Attribution | Marketing efforts resulting in won revenue | Enterprise |
| Customer Journey Analytics | Conversion rates between lifecycle stages | Professional, Enterprise |
HubSpot's attribution tools, combined with its integration ecosystem, give marketers the ability to work with consistent, real-time data across multiple platforms.
Integration with 1,900+ Tools
HubSpot's ecosystem integrates data from over 1,900 apps, creating a centralized hub for managing customer information. HubSpot Data Sync supports one-way or two-way synchronization with third-party apps, ensuring data consistency across systems. For businesses with complex needs, the platform allows multiple instances of tools like Microsoft Dynamics within a single account, making it easier to manage regional or departmental sales data. Event Sync further enhances functionality by pulling specific interaction data - such as email opens or clicks - into HubSpot contact records.
To maintain clean and accurate data, HubSpot offers a Data Quality Command Center that identifies anomalies and streamlines data management. The Operations Hub automates tasks like deduplication and formatting, ensuring that inconsistent naming conventions don’t disrupt analytics. When multiple platforms are synced, users can designate a "default app" in the settings to resolve conflicts.
For more advanced analytics, external tools like Count integrate seamlessly with HubSpot, using AI and SQL/Python to extend attribution capabilities. This flexibility makes HubSpot a fit for businesses of all sizes - whether small teams relying on basic data sync or enterprises leveraging custom field mappings through a paid Data Hub subscription.
If you're considering email marketing platforms to complement your analytics, the Email Service Business Directory provides a curated list of tools and services that integrate smoothly with HubSpot.
Improvado: Data Collection and Standardization
Improvado simplifies data integration by connecting over 500 platforms - like Google Ads, Facebook Ads, TikTok Ads, email marketing platforms, and Salesforce - into a unified pipeline. It handles API limits, token updates, pagination, and batching automatically, so teams don’t have to juggle multiple APIs. If a pre-built connector isn’t available, the platform’s AI tool can create custom integrations using straightforward prompts.
The platform’s ONE module acts as a universal REST API, merging all connected data into one endpoint. After extracting the data, Improvado uses more than 15 pre-built data models to standardize it. These models join tables, rename metrics, and perform calculations, ensuring terms like “spend” from Facebook align with “cost” from Google Ads. This standardization creates consistent KPIs across all channels, supporting a unified analytics approach.
Jeff Lee, Head of Community and Digital Strategy at ASUS, used Improvado to centralize global marketing data in a managed BigQuery instance. This eliminated the need for manual data standardization across regions, significantly improving efficiency.
"Improvado saves us 90 hours each week and allows us to focus on data analysis rather than routine data aggregation, normalization, and formatting." – Jeff Lee, ASUS
Data Pipeline Process
Improvado’s automated ETL (Extract, Transform, Load) process builds on the ONE module to streamline data management. By replacing manual spreadsheet workflows - which can take over 20 hours a week - the platform automates the entire ETL process. It can pull up to 10 years of historical data (subject to API limits), enabling accurate year-over-year comparisons and long-term attribution analysis. Data updates occur as frequently as every hour, ensuring business intelligence tools like Tableau, Looker, or Power BI receive near-real-time information.
Improvado also includes a data governance layer that resolves campaign naming inconsistencies and quality issues before the data reaches dashboards. This ensures every table is clean and analysis-ready. The platform supports delivery to over 20 enterprise-grade destinations, including Snowflake, BigQuery, Redshift, and S3.
Signal Theory Inc. used Improvado to automate client reporting, reducing preparation time from four hours to just 30 minutes per report - a time savings of 87.5%. Analyst Shayna Tyler highlighted the impact on team efficiency:
"Reports that used to take hours now only take about 30 minutes. We're reporting for significantly more clients, even though it is only being handled by a single person", says Shayna Tyler.
Scaling for Business Growth
Improvado’s "auto-extraction" feature allows businesses to quickly scale by templatizing and adding thousands of new accounts per platform without manual setup. This is particularly useful for companies expanding across regions or channels. With access to over 40,000 unique data fields, the platform supports granular analysis down to the keyword level.
Eicoff, a performance marketing agency, reduced client onboarding time from one month to just a few days - a 15x improvement - saving $500,000 annually in staffing costs. Similarly, Booyah Advertising migrated over 600 reports to Improvado, achieving 99.9% data accuracy while cutting the time needed for daily performance insights in half.
Organizations using Improvado report an average of 70% cost savings per data source integration and a $75,000 total economic impact per integration. Companies leveraging real-time, data-driven optimization through platforms like this can see a 31% boost in campaign ROI and reduce marketing waste by 21%.
| Feature | Capability |
|---|---|
| Data Sources | 500+ pre-built connectors (Ads, CRM, Social, SEO, eCommerce) |
| Data Granularity | Campaign, geo, ad, and keyword level |
| Update Frequency | Up to hourly updates |
| Destinations | 20+ (BigQuery, Snowflake, Redshift, S3, PostgreSQL, etc.) |
| Transformation | 15+ pre-built models; no-code mapping and normalization |
Platform Comparison
After diving into the features of each platform, here's a quick rundown to help you pinpoint the best fit for your needs.
The choice of a cross-channel analytics platform largely hinges on factors like your business size, technical infrastructure, and channel priorities. Google Analytics 4 excels in web and mobile tracking with seamless Google integration, making it a strong contender for businesses heavily focused on digital. Adobe Analytics, on the other hand, extends its capabilities to offline channels, including call centers and in-store interactions. For those seeking a blend of marketing automation and CRM tracking, HubSpot offers over 1,000 integrations to follow the customer journey from lead generation to sales.
Platforms like Improvado and Domo emphasize powerful data infrastructures. Improvado automates data collection from over 500 sources, while Domo supports more than 1,000 prebuilt connectors, covering everything from cloud platforms to IoT devices. These tools focus on creating a robust data pipeline for analytics dashboards, unlike Bird and Experiture, which are tailored for managing cross-channel communications.
Bird is designed to unify messaging channels such as email, SMS, and push notifications, with over 100 prebuilt integrations for platforms like Shopify and Salesforce. Impressively, it handles 40% of global email and SMS traffic across 150+ countries.
Experiture stands out by supporting both digital and physical channels, including direct mail, mobile wallets, geofencing, and interactive voice response (IVR).
Cordial focuses on processing massive datasets in milliseconds, leveraging AI to optimize individual messages and broader strategies. Businesses transitioning to Cordial have reported up to a 50% revenue increase per email, with implementations averaging just 58 days.
Klaviyo offers built-in multi-touch attribution models that can even be applied retroactively. It provides unified reporting across email, SMS, WhatsApp, and push notifications.
These platforms go beyond traditional analytics by integrating messaging and multi-channel attribution capabilities, opening up new possibilities for businesses looking to enhance their customer engagement.
Feature Comparison Table
Here’s a quick snapshot of the core features offered by each platform:
| Platform | Real-Time Segmentation | Key Supported Channels | AI Analytics Capabilities | Integration Options |
|---|---|---|---|---|
| Google Analytics 4 | Yes | Web, Mobile App | Predictive metrics, anomaly detection | Google Ads, Search Console, BigQuery |
| Adobe Analytics | Yes | Web, Mobile, Offline (call center, in-store) | Customer Journey Analytics, predictive intelligence | CRM, Call Center, Loyalty Programs |
| Improvado | Yes | 500+ marketing data sources | Data standardization | BigQuery |
| HubSpot | Yes | Email, Social, Paid Ads, CRM | Multi-Channel Attribution | 1,000+ connectors (CRM, Email, Social) |
| Bird | Yes | Email, SMS, WhatsApp, RCS, Push, Voice | AI Chatbots (OpenAI/Azure), fallback logic | 100+ (Shopify, Salesforce, Webhooks) |
| Klaviyo | Yes | Email, SMS, WhatsApp, Push, 3rd-party ads | AI-powered channel affinity, predictive analytics | Ecommerce platforms, Webhooks |
| Experiture | Yes (via CDP Hub) | Email, SMS, Direct Mail, Mobile Wallet, Geofencing, IVR | AI predictive intelligence, send-time optimization | Native CRM (Salesforce, Dynamics), SOAP/REST APIs |
| Cordial | Yes (Millisecond processing) | Email, SMS, Mobile App, Website | AI message/audience optimization | Any source via integration tools |
| Domo | Yes | Business Intelligence across all data types | AI-powered insights, predictive analytics | 1,000+ prebuilt connectors (Cloud, IoT, Databases) |
How to Choose the Right Platform
Integration and Data Management
A good platform should cut down on the manual work that often eats into productivity. Think about this: teams lose nearly two full workdays each week managing spreadsheets and wrestling with fragmented data instead of focusing on more impactful tasks. That’s a lot of time that could be better spent.
Integration is key here. It creates what’s called a unified intelligence layer - a single point where all customer interactions come together. This allows you to connect every dollar spent back to real revenue. Without this level of integration, your data stays scattered across email, social media, and CRM systems, making it hard to see the full customer journey.
The right platform will unify customer interactions from multiple devices and automatically standardize the data for accurate reporting. For instance, if a customer browses on their laptop but completes a purchase on their phone, the platform should link these actions into one cohesive profile. Why does this matter? Because customers are 3.5× more likely to buy when their interactions are recognized across channels.
"Cross-channel strategy is no longer a martech conversation. It is a revenue conversation." - Shabika Venkidachalam, Two Minute Reports
Before you commit to a platform, take the time to audit your current data sources. Look for inconsistencies and set up universal naming conventions for UTM parameters and campaign taxonomy. This step ensures that your data integration is strong enough to support advanced analytics and reporting.
Growth Capacity and Channel Support
Once your data integration is in place, focus on finding a platform that can grow with your business. As your contact list expands and message volume spikes, the platform should maintain performance without any hiccups. The best tools can process massive datasets in milliseconds, which is crucial for businesses sending thousands of messages daily.
Understanding the entire customer journey requires multi-touch attribution. Platforms that only track last-click attribution leave out important context. Look for tools that offer flexible attribution models, such as linear or custom options, and ensure they can apply these models retroactively to your historical data.
If your business involves both digital and offline channels, make sure the platform can handle both seamlessly. For example, 76% of B2C brands find it challenging to activate offline data for cross-channel marketing, but those that manage to coordinate their strategies see a 13% higher return on ad spend. Whether you’re running physical stores, call centers, or direct mail campaigns, your platform should integrate this data alongside digital interactions.
Another important factor is scalability. As your data volume grows, the platform should handle the increased load without slowing down. Flexible API support is crucial for future integrations. Look for tools that support SOAP/REST APIs and offer native CRM integrations with systems like Salesforce or Dynamics. This flexibility allows you to add new tools to your marketing stack without overhauling your infrastructure.
Lastly, consider platforms with advanced AI and predictive features. Tools that can forecast churn, predict purchase behaviors, and recommend the next best action will become increasingly valuable as your business scales. Using unified data for personalized messaging can lead to 232% higher conversion rates compared to generic approaches.
Conclusion
Selecting the right cross-channel analytics platform is all about finding a tool that matches your business needs today while supporting your growth tomorrow. Each platform we've discussed has its strengths - whether it's Google Analytics 4 for smaller teams, Adobe Analytics for enterprise-level demands, or Improvado for simplifying data standardization.
Start by ensuring your data is clean and consistent. Before migrating to a new platform, make sure your data sources are aligned and UTM parameters standardized. Why? Because clean data is the backbone of accurate analytics. In fact, experts point out that brands maintaining consistent messaging across channels can achieve up to 23% revenue growth. Without this foundation, even the most advanced tools won't provide reliable insights.
When evaluating platforms, prioritize those that go beyond last-click attribution. Today’s customers interact with a brand six or more times before making a purchase. To understand their journey, you need visibility into every interaction. Companies using coordinated cross-channel strategies see a 13% higher return on ad spend, proving the value of tracking every touchpoint.
Finally, consider scalability. Will the platform grow with you? Can it handle larger data volumes and offer AI-powered features like churn prediction or next-best-action modeling? The brands that thrive are those that take ownership of their customer data and use it strategically across every channel.
FAQs
How do I connect email and social analytics into one report?
To bring email and social analytics together in one report, you’ll need platforms that handle cross-channel data integration. Tools such as Sprout Social and CampaignSwift make it possible to merge data from both email campaigns and social media into a single, unified report. The process usually involves exporting data from each platform and feeding it into a reporting tool. This approach gives you a more complete picture of how your marketing efforts are performing across channels.
Which platform is best for tracking a customer across devices and channels?
Blueshift excels at keeping tabs on customers across different devices and channels. By merging behavioral, transactional, and identity data, it builds real-time, unified customer profiles. This allows businesses to deliver highly personalized, cross-channel experiences through email, SMS, push notifications, and in-app messaging. Its robust tracking capabilities make it a standout option for managing customer interactions across various touchpoints.
Do I need a data warehouse for cross-channel attribution?
A data warehouse isn’t absolutely necessary for cross-channel attribution, but it can make scaling and analyzing data much easier. Many tools already combine data from sources like social media and email to map out customer journeys. For smaller operations, direct integrations with these tools might be enough. However, for larger or more complex setups, a data warehouse offers centralized storage, allows for advanced querying, and provides better data management. This leads to more precise and detailed attribution insights.