If I had to pick one default B2B email cadence in 2026, I’d pick weekly. It usually gives the steadiest mix of engagement and list health. Biweekly often works better for longer sales cycles. Daily sends tend to push unsubscribe and spam complaint rates too high unless the list signed up for a daily news-style format.
Here’s the short version:
- Weekly is the safest starting point for most B2B programs
- Biweekly can hold clicks and replies while cutting fatigue
- Daily or near-daily often leads to lower clicks, fewer replies, and more complaints
- Open rates are less reliable now because Apple Mail Privacy Protection can inflate them by 35% to 45%
- In practice, I’d watch CTR, replies, unsubscribes, and spam complaints more closely than opens
- 0.3% spam complaints is the line to watch, and 0.5%+ can lead to mailbox provider action
The article also shows that list source matters. Large newsletters need tighter segmentation as they grow, and paid-growth lists usually have much lower tolerance for frequent sends than organic opt-in lists.
Quick Comparison
| Send cadence | Engagement pattern | Unsubscribe risk | Spam complaint risk | Best fit |
|---|---|---|---|---|
| Weekly | Steady opens and clicks | Low | Low | Most B2B newsletters and nurture sends |
| Biweekly | Often flat to slightly better clicks and replies | Lower | Lower | Longer sales cycles, lower-engagement segments |
| Daily / near-daily | Opens flatten, clicks and replies often drop | High | High | Mostly daily news-style opt-in emails |
If you’re setting cadence in 2026, the rule is simple: send based on audience behavior, not your calendar. This approach is a key part of choosing the right email marketing platform for your specific needs.
sbb-itb-6e7333f
Method: Sources, Definitions, and Data Limits
Data sources for 2024–2026 benchmarks
This summary uses 2024–2026 benchmark reports based on large campaign samples, along with current Gmail, Outlook, and Yahoo deliverability rules that shape frequency results. The goal is simple: compare how weekly, biweekly, and daily sending affect engagement and complaint risk.
How to read opens, clicks, replies, and complaint rates in 2026
Open rates are directional only because Apple Mail Privacy Protection inflates reported open rates by 35% to 45%. So if opens look strong, that doesn't automatically mean your cadence is working.
Instead, use click rate, reply rate, unsubscribe rate, and spam complaint rate as the main signals for cadence. CTOR still helps because it measures content response apart from open inflation.
At higher frequency, spam complaints matter more than anything else. 0.3% is a critical warning threshold, and rates above 0.5% can lead to throttling or blocking.
The next section compares these metrics across weekly, biweekly, and daily B2B send cadences, which are supported by the best email marketing platforms for small business.
B2B Engagement Benchmarks by Send Frequency
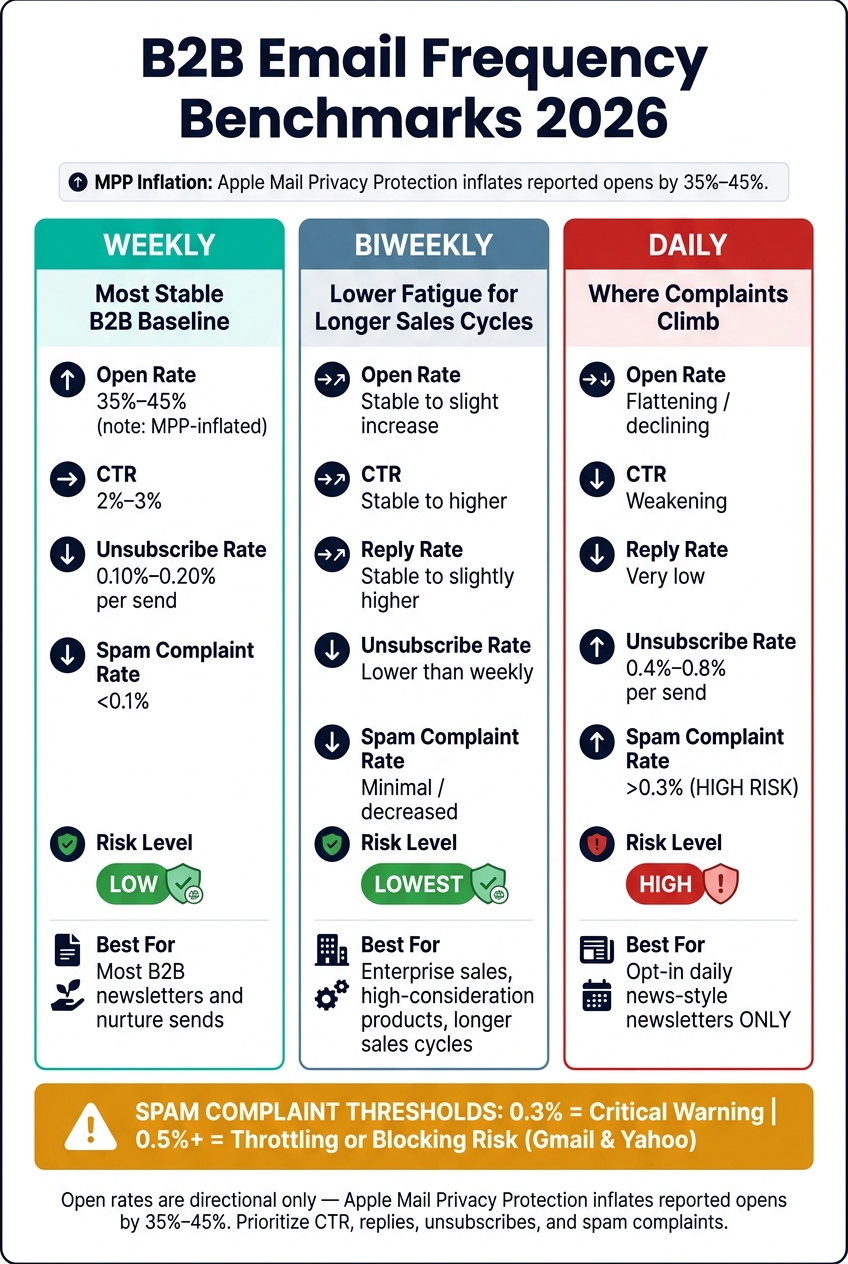
B2B Email Frequency Benchmarks 2026: Engagement & Risk by Send Cadence
These are directional benchmark bands for 2024-2026, not hard targets. Your numbers will move with list quality, industry, and segmentation. Still, the patterns below are steady enough to use as a practical reference point.
Weekly sending: the most stable B2B baseline
Weekly cadence is a common B2B starting point. Open rates often land in the 35%-45% range. CTR usually sits around 2%-3% for newsletters. Unsubscribe rates tend to stay near 0.10%-0.20% per send, and spam complaints are usually below 0.1%.
At this pace, lifecycle emails tend to beat newsletters on clicks and replies. Promotional emails usually lag behind and come with more unsubscribe risk.
If weekly sends start pushing unsubscribes up, biweekly is often the safer move.
Biweekly sending: lower fatigue for longer sales cycles
For enterprise sales, high-consideration products, and other longer-cycle programs, more space between sends often helps. Engagement tends to stay flat or tick up a bit, while unsubscribes and complaints usually move down. Reply rates also tend to hold steady or improve a little, since less frequent emails can feel more intentional to the reader.
| Metric | Weekly → Biweekly Directional Change |
|---|---|
| Open Rate | Slight increase or stable |
| CTR | Stable to higher |
| Reply Rate | Stable to slightly higher |
| Unsubscribe Rate | Lower (reduced fatigue) |
| Spam Complaints | Minimal / decreased |
After that, frequency gets less forgiving, and list quality starts to matter even more.
Daily and near-daily sending: where complaints climb
Daily sending is where B2B benchmarks start to soften. On broad marketing lists, open rates flatten out and CTR tends to weaken outside highly engaged segments. Reply rates drop hard versus weekly sends because higher volume can make each email feel less relevant. Unsubscribes move toward 0.4%-0.8% per send, and spam complaint risk rises above the 0.3% ceiling that Gmail and Yahoo enforce.
There is one clear exception: opt-in news-style newsletters with daily expectations, like daily industry briefs. Those can keep open rates stable and complaint rates low because subscribers signed up for that exact cadence.
At daily cadence, the benchmark shifts from growth to complaint control.
| Send Category | Open Trend | CTR Trend | Reply Rate | Unsubscribe Risk | Spam Complaint Risk | Common B2B Use Case |
|---|---|---|---|---|---|---|
| Daily B2B Marketing | Flatter / declining | Weakening | Very low | High (0.4%-0.8%) | Steep (>0.3%) | Broad promotional sends |
| Daily News-style Newsletter | Stable | Healthy | Low | Low (<0.2%) | Low (<0.1%) | Daily industry briefs |
Scale changes these limits again, especially for large newsletters and paid-growth lists.
How Benchmarks Shift for Large Newsletters and Paid-Growth Lists
List quality changes how much email people will tolerate. So the same send cadence can work fine on one list and fall apart on another - especially once volume grows.
Large B2B newsletters: why scale increases segmentation pressure
A weekly send often works well early on, before segments start to drift apart. But as a list grows, people join from different channels, have different job roles, and show very different levels of interest. At that point, one fixed frequency stops working for everyone.
The numbers make that plain. Roughly 24% of subscribers - the most active group - drive 83% of total reads, but they also account for 50% of all spam complaints when frequency starts to feel too high. That's why large newsletters need segmentation, not one-size-fits-all scheduling.
| Cohort | Typical Opens (MPP-Adjusted) | Typical CTR | Unsubscribe Rate | Complaint Rate |
|---|---|---|---|---|
| Core Engaged | 40-55% | 4-12% | <0.1% | <0.02% |
| New Subscribers | 35-50% | 3-6% | 0.15-0.2% | 0.05% |
| Inactive (90+ days) | <10% | <0.5% | 0.5%+ | 0.1-0.3% |
Blanket frequency increases ignore those tolerance gaps and push complaint rates up. A better approach is cohort-level frequency control: send more often to engaged readers, pull back for occasional openers, and suppress contacts who have been inactive for 90+ days.
Paid-growth lists: lower tolerance for higher frequency
Paid-growth lists are less forgiving than large organic newsletters because trust starts lower. If someone came in through paid acquisition, co-registration, or lead-gen, they didn't build a relationship with your brand first. That makes frequent sends much harder to get away with, and complaint risk rises faster on colder lists.
Cold outbound and paid-growth lists show a median complaint rate of 0.35%. Organic opt-in lists sit much lower, at 0.08%. In practice, that means paid-growth lists often hit complaint limits sooner even when the send frequency matches an organic list. Sustained complaint rates above 0.5% can trigger throttling and blocking.
| List Type & Frequency | Open Rate Band | CTR Band | Unsubscribe Band | Complaint Band |
|---|---|---|---|---|
| Organic B2B (Weekly) | 22-32% | 2-5% | 0.1-0.3% | 0.02-0.08% |
| Paid-Growth B2B (Weekly) | 18-28% | 1-3% | 0.5-1.5% | 0.15-0.35% |
| Paid-Growth (2-3x/Week) | 12-20% | 0.5-1.5% | 1.5-3.0% | 0.35%+ |
For paid-growth lists, triggered and lifecycle emails beat broad broadcast sends on both engagement and list health. Automated or triggered emails produce 52% better open rates and 2,361% better conversion rates than standard broadcast campaigns. That makes sense. An onboarding series, a behavior-based trigger tied to a product action, or a re-engagement flow gives people a clear reason to get the email. A cold broadcast usually doesn't.
Start with a low send frequency, then increase in small steps while watching complaint rates closely. And don't just watch the percentage. Watch total complaint volume too, because raw complaints can climb with scale even when the rate looks flat.
At scale, frequency only works when you segment by engagement and list source.
Conclusion: What 2026 Frequency Benchmarks Mean for B2B Teams
In 2026, B2B email frequency should follow how your audience acts - not what your calendar says. Weekly is the default starting point. Biweekly makes sense for longer sales cycles. Daily only works for opt-in news briefs with tight segmentation.
When you judge cadence, don't lean on opens alone. Look at the signals that show what people do: clicks, replies, unsubscribes, and spam complaints. And keep a close eye on complaints - 0.3% is the ceiling.
FAQs
How should I test email cadence?
Take a gradual, data-driven approach instead of leaning on one-size-fits-all benchmarks. Move frequency up in small, controlled steps - for example, from two sends a week to three for a set trial period.
Then watch the numbers that matter most: clicks and conversions. If click-through rates fall by more than 25%, or unsubscribes climb above 0.5% per email, pull frequency back. Be careful with open rates, since they can look higher than they actually are.
When should I suppress inactive subscribers?
Suppress subscribers who haven’t opened or clicked your emails for 90 days. But don’t cut them right away. First, move them into a targeted reactivation sequence and give them a chance to re-engage.
This kind of list hygiene matters more than most teams think. It helps protect your sender reputation, improves deliverability, and can keep your emails out of spam folders. It also lifts your engagement rates by removing contacts who aren’t responding.
Do triggered emails work better than broadcasts?
Yes. In 2026 data, triggered emails beat broadcast campaigns across the board - with 52% higher open rates, 332% higher click rates, and up to 2,361% higher conversion rates.
They usually account for a small slice of total send volume. But they often bring in most email revenue. The reason is pretty simple: they show up in response to a specific action, like cart abandonment or an onboarding milestone.