I compare bulk email APIs by delivery timing, not just response speed. My starting acknowledgment targets are p50 below 200 ms and p95 below 500 ms - not industry standards. A fast response does not prove delivery or inbox arrival.
Before choosing a provider, I check:
- Each stage: acknowledgment, queue delay, handoff, recipient delivery, batch completion, and webhook delay.
- Load performance: sustained throughput, bursts, p95/p99 latency, errors, and retries under matching test conditions.
- Proof and visibility: dated results, account limits, event timestamps, and records that let me trace failed or delayed sends.
- Inbox arrival and cost: monitored mailbox tests kept separate from server acceptance, plus verified monthly pricing in USD.
My rule: <u>test first, compare prices second</u>. I choose against workload-specific pass/fail targets, then keep the pilot results as a baseline for monitoring and future tests.
Best Email API for Bulk Sending? We Have the Answer
sbb-itb-6e7333f
Understand Bulk Email Latency Metrics
Bulk Email API Latency: Acceptance vs. Delivery
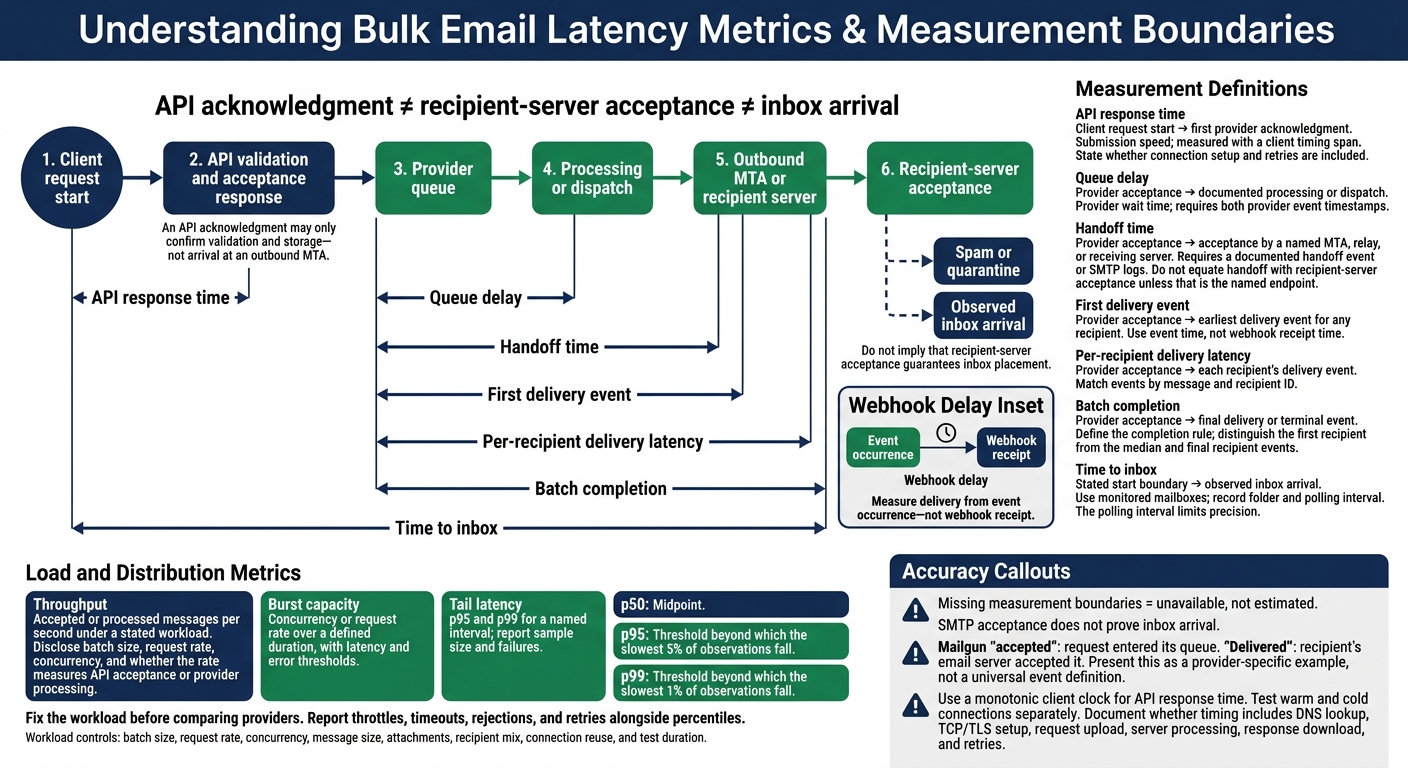
Map the email path as client request start → API validation and acceptance response → provider queue → processing or dispatch → outbound MTA or recipient server → recipient-server acceptance. Keep each boundary separate. An API acknowledgment may only confirm that the provider validated and stored the message, not that it reached an outbound MTA.
Score providers on what they can prove, not a single latency number. These metrics separate submission speed from delivery speed.
| Metric | Measurement boundaries | Buyer use case | Timestamp source or test method |
|---|---|---|---|
| API response time | Client request start → first provider acknowledgment | Submission speed | Client timing span; state whether connection setup and retries are included |
| Queue delay | Provider acceptance → documented processing or dispatch | Provider wait time | Provider event timestamps; unavailable if either boundary is missing |
| Handoff time | Provider acceptance → acceptance by a named MTA, relay, or receiving server | Campaign and alert timing | Documented handoff event or SMTP logs; unavailable without reliable endpoints |
| First delivery event | Provider acceptance → earliest delivery event for any recipient | Delivery start | Event time, not webhook receipt time |
| Per-recipient delivery latency | Provider acceptance → each recipient’s delivery event | Recipient and domain delays | Events matched by message and recipient ID |
| Batch completion | Provider acceptance → final delivery or terminal event | Campaign completion | Batch-level and per-recipient tracking; define the completion rule |
| Webhook delay | Event occurrence → webhook receipt | Monitoring responsiveness | Provider event timestamp plus client receipt timestamp |
| Time to inbox | Stated start boundary → observed inbox arrival | Recipient visibility | Monitored mailboxes; record folder and polling interval |
| Throughput | Accepted or processed messages per second under a stated workload | Sustained capacity | Load test; disclose batch size, request rate, concurrency, and whether results measure API acceptance or provider processing |
| Burst capacity | Concurrency or request rate over a defined duration | Volume-spike tolerance | Load test with latency and error thresholds |
| Tail latency | p95 and p99 for a named interval | Slowest experiences | Timestamp distribution; report sample size and failures |
API Response Time, Queue Delay, and Handoff Time
Measure API response time with a monotonic client clock. Test warm and cold connections separately, and document whether timing includes DNS lookup, TCP/TLS setup, request upload, server processing, response download, and retries.
Define what the acknowledgment confirms before releasing work. If either measurement boundary is missing, mark queue delay or handoff time as unavailable rather than estimating it.
First Delivery Event and Time to Inbox
Check event definitions before calculating latency. Mailgun’s accepted means the request entered its queue; delivered means the recipient’s email server accepted it. The earliest delivery event covers only the first recipient. Report median and final recipient events separately.
Measure inbox arrival using monitored consumer and corporate mailboxes. State whether timing starts at client submission or provider acceptance. Record folder placement, account type, authentication, content, and polling interval. The polling interval limits measurement precision. SMTP acceptance does not tell you whether later filtering placed the message in spam or quarantine.
Throughput, Burst Capacity, and Tail Latency
Report messages per second for a stated workload, and specify whether the rate measures acceptance or processing. Include batch size, request rate, concurrency, message size, attachment use, recipient mix, connection reuse, and test duration. Define burst capacity by duration, request rate or concurrency, latency threshold, and error tolerance.
p50 shows the midpoint; p95 and p99 mark the thresholds beyond which the slowest 5% and 1% of observations fall. Use recipient-delivery tail latency to assess campaign windows and time-sensitive retention messages.
Report throttles, timeouts, rejections, and retries alongside percentiles so fast successful requests do not hide failed sends. In reviews, give p95/p99 and error rates more weight than averages. Fix the workload before comparing providers.
Test Providers Under Matching Conditions
Set Workloads and Load Levels
Run each provider under the same workload after you define the metrics. Matched conditions are the only way to compare latency, limits, and visibility across providers.
Build separate transactional and promotional tests around your daily volume, peak pattern, and recipient-domain mix. Use only authorized recipients, including Gmail, Outlook, and Yahoo accounts. Keep message size, batch size, sender domain, authentication, test region, connection reuse, and concurrency fixed. Record the test date, sample size, account status, sender reputation, IP model, and warm-up state.
Start with sequential requests. Then sustain 25%, 50%, and 100% of expected peak demand for 15–30 minutes each. Add a controlled burst within provider limits, then allow a cooldown. Repeat each scenario at least 3 times across multiple days.
Check account quotas before testing. SES counts recipients, and its 24-hour quota is separate from its per-second send rate.
Record Timestamps, Errors, and Retries
Link each application request ID to provider-assigned message IDs and recipient-level events. Record client start, acknowledgment, provider event, and webhook receipt times. Use monotonic timers for local durations and synchronized UTC clocks with stated precision for cross-system intervals. Measure delivery timing from the provider event time, not the webhook receipt time. Keep raw event payloads.
Report acknowledgment p50/p95/p99 with sample counts, per-recipient latency, and batch completion time. Log HTTP errors, 429 responses, timeouts, partial acceptance, retry delays, Retry-After guidance, and final outcomes. Flag ambiguous timeouts and possible duplicate sends. Use idempotency support where available.
Set delivery and mailbox observation windows before the run. Keep missing or late events as unresolved observations rather than dropping them. Label p99 from 20 requests as directional only.
Compare Test Results and Provider Limits
Use this worksheet to compare measured latency and documented limits. Compare only results from the same workload and account state. Blank cells mean not measured or verified, not zero latency. Fill them only with data from your pilot or current account documentation.
Keep documented limits separate from measured sustained throughput and burst capacity. SES notes that actual acceptance can be lower than its maximum sending rate. Attach the conditions record to every result.
| Provider | Acknowledgment p50 / p95 / p99 (ms) | Documented limits | Queue/delivery-event visibility | Webhook delay | Burst capacity | Test conditions |
|---|---|---|---|---|---|---|
| Amazon SES | Record regional account quota and maximum send rate | Record configured event destinations | ||||
| Mailgun | Record account-specific limits | Record Events API and webhooks | ||||
| SendGrid | Record account-specific limits | Record available event-stream or webhook visibility | ||||
| Postmark | Record account-specific limits | Record available delivery-event visibility | ||||
| SparkPost | Record account-specific limits | Record webhook and event visibility |
Use these results to populate the buyer scorecard.
Build a Buyer Scorecard
Assess Benchmarks and Service Reviews
Use the measured results above to score each provider. Rank providers by verified evidence, not claims. Accept dated benchmarks only when they disclose the source, workload, sample size, geography, account settings, and event definitions. Score p50, p95, and p99 separately for idle, sustained, and burst traffic. Use reviews only to identify test points for webhooks, throttling, retries, and rate limits.
Score API uptime separately from webhook availability and delivery outcomes. Turn those scores into the pass/fail requirements below.
Set Targets and Request Provider Proof
Set mandatory requirements before assigning weights. The acknowledgment targets below are starting targets, not standards. Set other deadlines based on the workflow. Keep provider processing separate from recipient-dependent delivery and inbox observations. Mark missing measurements unobservable. If visibility is mandatory, a missing measurement fails that requirement.
| Metric | Workload-dependent target | Required provider proof | Test method | Pass/fail result |
|---|---|---|---|---|
| API response time | Starting targets: p50 below 200 ms; p95 below 500 ms | Timestamp definition, percentiles, region, sample size, and account tier | Send identical requests with connection reuse; report p50, p95, and p99 | Pass only if the workload and percentile target are met |
| Queue delay | Application deadline | Acceptance and queue-release timestamps | Compare provider acceptance with the next provider event that documents queue release | Fail if the interval cannot be exposed or defined |
| Handoff time | Workload-specific p95 target for priority mail | Named handoff endpoint and timestamp definition | Measure from provider acceptance to the documented handoff event | Mark unobservable if only a generic “sent” status is available |
| First delivery event | Target based on urgency | Event schema, timestamp semantics, and delivery-status definitions | Match message IDs to webhook events and event history | Pass only when event timing and ordering can be verified |
| Monitored inbox arrival | Separate inbox-arrival target | Permission to test designated mailboxes and disclose mailbox geography | Send seeded messages to monitored inboxes and measure arrival | Report as an observation, not a provider SLA |
| Throughput | Required messages per second or per minute | Confirmed rate limits and capacity policy | Run sustained-load tests within approved limits | Pass if throughput and error rate meet targets |
| Burst capacity | Peak messages within a defined window | Burst allowance, throttling behavior, and scale-up process | Run an approved burst; record 429, 5xx, and queue growth | Fail if throttling is undocumented or recovery is unpredictable |
| Event traceability | Required lifecycle timestamps and usable incident records | Payloads, timestamp precision and time zone, retention, export options, event IDs, and ordering/deduplication rules | Export records; reconcile timestamps and IDs across delivery, bounce, and retry paths | Pass if records are complete, timestamps reconcile, and consumers can handle duplicates and reordering |
| Retries | Defined conditions, schedule, maximum attempts, and idempotency behavior | Retry documentation and Retry-After handling |
Trigger transient errors and confirm backoff behavior | Pass if retries avoid duplicate sends and respect limits |
| Concurrency | Planned concurrent requests or connections | Account-specific concurrency limits | Increase concurrency gradually; measure p95 and errors | Fail if performance collapses below planned concurrency |
| Scale-up procedure | Capacity available before launch | Written process, lead time, eligibility, and fees | Request a capacity increase and record response time | Pass only if the procedure works before launch |
Get written confirmation of regional endpoints, connection reuse, HTTP/2 support on the relevant hostname, and SDK pooling, timeouts, automatic retries, and idempotency. Check the intended failover endpoint as well.
For webhooks, require signing, retry schedules, duplicate behavior, retention, and confirmation that event history can be queried later. A fast API cannot make up for missing event traceability or unsafe retries.
Shortlist Providers and Compare Costs
Once a provider passes the latency scorecard, verify pricing with dated quotes. Use Email Service Business Directory to find platforms, tools, and agencies - not as a latency benchmark. Exclude providers that fail mandatory requirements before comparing prices.
Do not estimate missing prices. Complete this checklist for each qualifying provider. Use dated official pricing or written quotes for the same monthly volume:
- Record the provider, pricing source, and verification date.
- Confirm monthly volume, included features, and overage rates.
- Verify message charges, dedicated IPs, support, log retention, validation, and required add-ons.
- Record the Verified monthly total (USD). Calculate it only from verified inputs; leave it uncalculated if any required price is missing.
Conclusion: Choose Against Measured Targets
Acceptance is not delivery. Separate provider processing from mailbox filtering and delays so you can compare providers on the same workload.
Choose the provider that meets your workload-specific scorecard targets in a pilot. Test realistic payloads, domains, concurrency, retries, and bursts. Judge p95, p99, errors, and throughput - not averages. Keep the pilot results as your post-launch baseline.
After launch, monitor queue delay, delivery events, webhook delay, errors, retries, and capacity. Set alerts for sustained increases in tail latency, and check missing events against provider history.
Re-test when volume, regions, payloads, or campaign patterns change. A passing pilot validates the workload you tested, not every future sending condition.
FAQs
How do I set realistic email delivery deadlines?
Set benchmarks around your system’s goals, and monitor queue age, delivery time, and throughput. Issue a warning when queue age reaches 15 minutes. At 30 minutes, trigger a critical alert and automatically fail over to a secondary relay.
For user-facing systems, use percentile-based SLOs: P95 under 200 ms and P99 under 1 second. Allow 1-2 minutes for warm-up. Apply exponential backoff to transient 4xx errors, and retry non-transactional mail for 72-120 hours.
How can I pinpoint the cause of delivery delays?
Track queue age, not just queue size. Messages waiting more than 15 minutes often point to DNS issues, TLS handshake failures, or reputation-based throttling. Growing queue depth or high retry counts typically signal mailbox-provider rate limiting.
Check SMTP 4xx responses for temporary deferrals and RFC 3463 enhanced status codes for infrastructure issues or invalid addresses. Use Jaeger or Zipkin to trace request paths and pinpoint bottlenecks.
How many test sends produce reliable p99 results?
There’s no fixed number of test sends needed for reliable p99 results. Use percentiles, not averages, to measure tail latency. Allow 1 to 2 minutes for JIT compilation and cache warming before recording results.
Test under actual usage conditions, including peak usage and failure scenarios. These tests can show performance behavior that technical specifications may miss.