I use market benchmarks as context, not targets. Before comparing your email results, check the measurement period: Validity’s 2026 report covers 2025 data, not October 2026 performance.
The regional summary puts Europe at 91.1% inbox placement and North America at 86.7%. But those figures don’t tell you where your messages land. <u>Assessing email platform compatibility is key because accepted mail is not the same as inbox placement.</u>
Here’s what I check before acting on a gap:
- Source and scope: Dates, countries, mailbox providers, sample sizes, and how each rate is calculated. Country data are limited, and some provider measurement periods remain unverified.
- Failure type: Spam, missing messages, confirmed blocks, and bounces need separate tracking. Missing mail is not proof of rejection.
- Provider rules: Complaint limits and sender requirements are policy rules, not market averages.
- Monthly results: Compare the same elapsed periods by sender, country, provider, and message stream. Keep test placement separate from production results.
My starting point is your own sender baseline. I use logs, provider dashboards, and placement tests to check declines, assign fixes, and track recovery - without assuming that placement changes caused revenue changes.
Email Deliverability Benchmark 2026: Why Your Emails Go to Spam
sbb-itb-6e7333f
Results by Region, Country, and Mailbox Provider
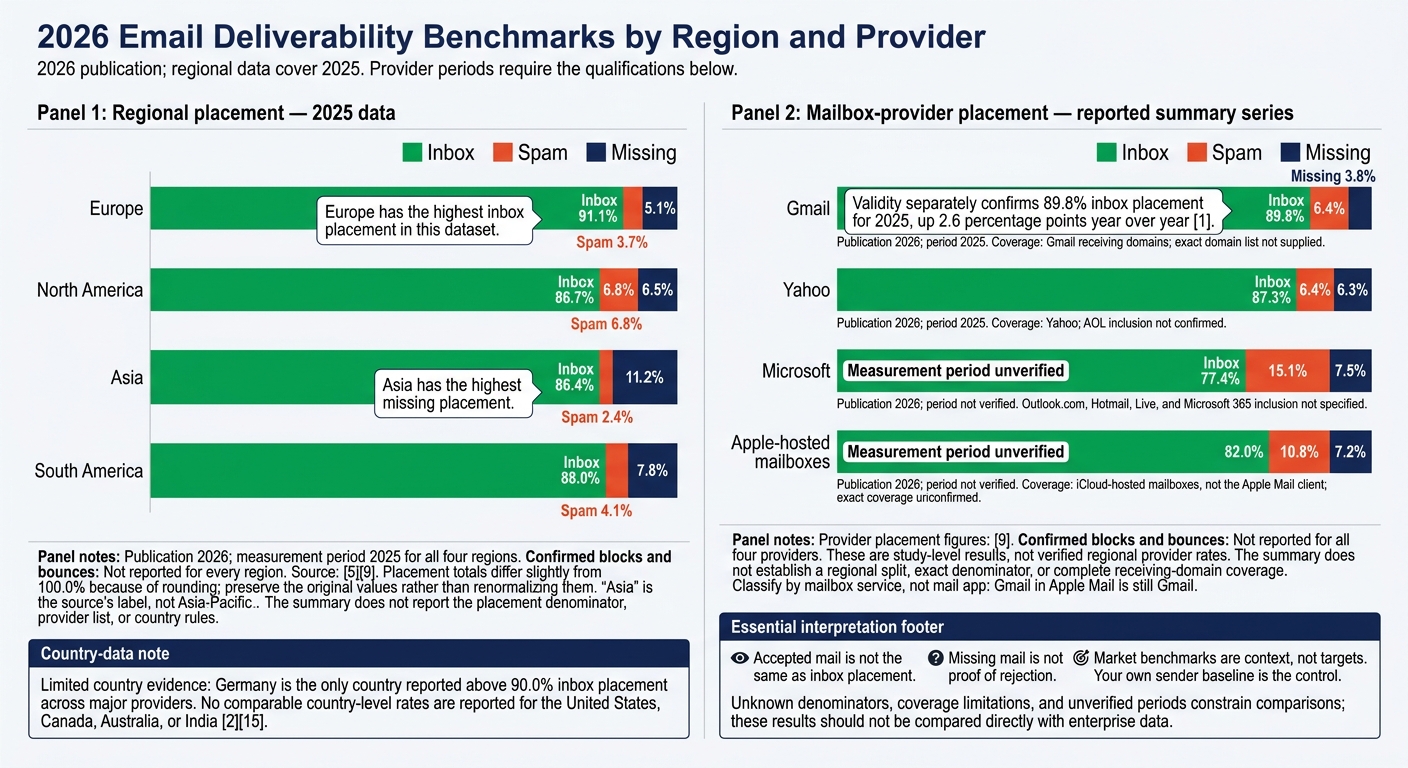
2026 Email Deliverability Benchmarks by Region and Provider
Regional Placement and Delivery Failure Rates
Europe has the highest inbox placement in this dataset; Asia has the highest missing placement. The figures below come from the Validity-associated 2026 summary. It does not report the placement denominator, provider list, or country rules, so these results should not be compared directly with enterprise data.
| Region | Inbox | Spam | Missing | Confirmed blocks | Bounces | Publication | Period |
|---|---|---|---|---|---|---|---|
| Europe | 91.1% | 3.7% | 5.1% | Not reported | Not reported | 2026 | 2025 |
| North America | 86.7% | 6.8% | 6.5% | Not reported | Not reported | 2026 | 2025 |
| Asia | 86.4% | 2.4% | 11.2% | Not reported | Not reported | 2026 | 2025 |
| South America | 88.0% | 4.1% | 7.8% | Not reported | Not reported | 2026 | 2025 |
Source:. Exact summary publication dates are not supplied. Placement totals differ slightly from 100.0% because of rounding. “Asia” is the source’s label, not Asia-Pacific.
Country-Level Results
Country data are sparse, limiting the benchmark to a few verified national results. Germany is the only country reported above 90.0% inbox placement across major providers. No comparable country-level rates are reported for the United States, Canada, Australia, or India.
Results for Gmail, Yahoo, Microsoft, and Apple
Provider results vary more than regional results in this series. All provider figures below come from one summary series. Validity separately confirms Gmail’s 89.8% inbox placement for 2025, up 2.6 percentage points year over year.
The summary does not establish a regional split, exact denominator, or complete receiving-domain coverage. Microsoft and Apple’s collection periods also need verification.
| Provider | Inbox | Spam | Missing | Confirmed blocks | Bounces | Publication / period | Receiving-domain coverage |
|---|---|---|---|---|---|---|---|
| Gmail | 89.8% | 6.4% | 3.8% | Not reported | Not reported | 2026 / 2025 | Gmail receiving domains; exact domain list not supplied |
| Yahoo | 87.3% | 6.4% | 6.3% | Not reported | Not reported | 2026 / 2025 | Yahoo; AOL inclusion not confirmed |
| Microsoft | 77.4% | 15.1% | 7.5% | Not reported | Not reported | 2026 / period not verified | Outlook.com, Hotmail, Live, and Microsoft 365 inclusion not specified |
| Apple-hosted mailboxes | 82.0% | 10.8% | 7.2% | Not reported | Not reported | 2026 / period not verified | iCloud-hosted mailboxes, not the Apple Mail client; exact coverage unconfirmed |
Source:. These are study-level results, not verified regional provider rates. Classify by mailbox service, not mail app: Gmail in Apple Mail is still Gmail.
Bounces, Blocks, and Sender Reputation
Regional placement gaps become actionable when you separate blocks, bounces, complaints, and authentication failures. These signals help explain month-to-month shifts. Use the metrics below to distinguish placement issues from rejections, delivery failures, and complaints.
Failure Metrics and Their Denominators
| Metric | What it measures | Denominator to record | Diagnostic action |
|---|---|---|---|
| Inbox placement | Test messages observed in the inbox | Successfully injected test messages; verify the vendor’s definition | Compare provider, domain, and traffic type |
| Spam placement | Test messages observed in spam or junk | Same placement-test population | Check complaints, authentication, and reputation |
| Missing placement | Test messages not observed within the test window | Injected or expected test messages, per vendor | Check delays, quarantine, and rejections |
| Confirmed blocks | Explicit provider or gateway rejection | Attempted messages or provider responses, depending on the platform | Group by SMTP code and rejection reason |
| Hard bounces | Permanent delivery failures | Attempted recipients, usually excluding suppressions | Suppress confirmed invalid addresses; investigate acquisition sources |
| Soft bounces | Temporary failures | Attempted recipients or retry attempts, per platform | Track retries through the final outcome |
| Total bounces | Hard plus soft bounces under the platform’s rules | Attempted recipients; disclose retry handling | Reconcile hard and soft definitions before comparing periods |
| Complaints | Recipient reports of unwanted mail | Delivered messages or provider-defined population | Check consent, frequency, and campaign targeting |
| Authentication failures | Failed SPF, DKIM, DMARC, or alignment checks | Messages checked by that system | Inspect DNS, signing, alignment, and forwarding |
A 4xx deferral is temporary; retries can still succeed. Suppress permanent address failures, but don’t treat policy rejections as proof that an address is invalid.
A 550 can count as a block, a hard bounce, or both, depending on the platform. Record the SMTP code, enhanced status code, host, timestamp, and retry outcome. Count each message once in primary reporting.
Provider Requirements and Reference Ranges
Provider rules are not market benchmarks. The table records the supplied policy guidance for the October 9, 2026 reporting cutoff. Where an exact effective date or denominator wasn’t supplied, it says so rather than making an assumption.
Use the same failure definitions when reading Gmail, Yahoo, Microsoft, and Apple results.
| Provider | Effective date or supplied status | Sender category | Traffic scope | Requirements or reference range | Denominator / measurement basis |
|---|---|---|---|---|---|
| Gmail | Current guidance | All senders | Gmail delivery | Use SPF or DKIM, keep infrastructure valid, and avoid unwanted mail. | Not supplied |
| Gmail | February 2024 requirements; guidance current October 9, 2026 | Bulk senders | 5,000 or more messages per day to Gmail accounts | Authenticate outgoing mail, publish DMARC, align the From domain with SPF or DKIM, provide one-click unsubscribe for promotional mail, and keep user-reported spam below 0.3%. Google recommends staying below 0.1%. | Gmail Postmaster Tools user-reported spam rate; other metrics require their own stated denominators |
| Yahoo | Current sender best practices | Bulk senders | Yahoo consumer mail | Authenticate mail and keep complaints below 0.3%. | Complaints divided by Yahoo-delivered mail or the feedback-loop sample |
| Microsoft Outlook.com | Current guidance; exact effective date not supplied | High-volume senders | More than 5,000 messages per day to Outlook.com, Hotmail, and Live | SPF, DKIM, and DMARC are required for the applicable traffic. Noncompliant messages may be routed to Junk or otherwise restricted. | Daily message volume and authentication results, not a universal bounce threshold |
Google states that bulk senders with a user-reported spam rate above 0.3% can lose access to delivery mitigations. Eligibility can return after the rate stays below 0.3% for 7 consecutive days. That does not guarantee inbox placement.
Treat hard-bounce targets below 0.5% and complaint targets below 0.1% as operating goals, not market benchmarks. Set failure alerts against your own provider-level baseline. Investigate authentication, complaints, and volume changes even when bounce rates stay low, and use the same denominators in monthly reporting.
Monthly Deliverability Reporting
Turn the defined failure metrics into a monthly scorecard. Benchmarks guide action only when you track them against your own sender, provider, and country mix.
Scorecard Metrics and Reporting Segments
Build one scorecard per sender, then aggregate the results for enterprise reporting. Segment every metric by country, mailbox provider, sending domain, IP pool or delivery service, message stream, acquisition source, consent status, and list age.
Use mailbox-country when available. Otherwise, document a fallback, such as billing country or IP-derived country, and retain Unknown for uncertain records. Calculate aggregate rates from summed numerators and denominators - never by averaging segment rates.
Use the layout below for each metric. Store its numerator, denominator, rate, and message count for every period. Label October reporting October month-to-date and show the days and messages included. Compare it only with the same elapsed September period unless both periods are normalized. Keep the prior month, rolling 3-month baseline, and year-to-date baseline separate.
| Scorecard metrics | Current / prior period | Rolling 3-month / YTD baseline | Variance | Suspected cause | Owner | Corrective action |
|---|---|---|---|---|---|---|
| Volume and failure counts | Counts and rates using fixed definitions | Pooled counts and denominators | Count change; percentage-point and relative rate change | Check provider, pool, and retry changes | Named owner | Record containment, fix, and due date |
| Seed and production placement, reported separately | Separate test and production populations | Comparable tests or observable populations only | Percentage-point and relative change; coverage change | Check stream and testing changes | Deliverability lead | Retest the affected stream consistently |
| Complaints; authentication pass rates; DMARC alignment; unsubscribes | Provider-defined or documented denominators | Pooled results where definitions match | Percentage-point and relative change | Check consent, source, signing, and frequency | Named stream owner | Record correction and verification date |
Use this same segment map to reconcile monthly totals.
Reconciling Data and Escalating Incidents
Reconcile platform totals and SMTP logs with provider dashboards, seed tests, and reputation data. Resolve differences caused by time zones, retries, duplicate events, suppression, and reporting delays.
Keep seed placement separate from production outcomes. Mark folder placement as unavailable when it cannot be observed; do not infer it. Include a data-quality note that identifies missing providers, excluded streams, and coverage. Preserve daily events and a dated change log for DNS, authentication, IP pools, sending volume, content, and provider policies.
Set escalation rules by sender, provider, and stream. Cover authentication failures, concentrated blocks, and market-level declines affecting multiple domains or streams within one country or mailbox provider. Each incident must include the first observed time, affected volume, containment decision, and restoration criteria.
Show percentage-point and relative changes, and flag small samples. Compare the observed aggregate with a fixed-mix result based on the prior month’s provider shares. Give every unexplained variance an owner and corrective action. In the next report, mark each one resolved, contained, or still under investigation.
Monitoring Tools and Retention Reporting
Choose tools that provide provider-level diagnostics, exportable raw logs, stable historical retention, and repeatable placement tests. They should also separate transactional, promotional, acquisition, and retention streams. Connect those logs to month-over-month reporting.
Require explicit accepted, blocked, inbox, spam, and unknown outcomes, along with records of methodology changes. Join lifecycle delivery trends to activation, renewal, expansion, and net revenue retention by recipient cohort. Use matched cohorts or holdouts where feasible rather than claiming that placement caused revenue changes.
The Email Service Business Directory is a vendor-discovery resource for email platforms, deliverability tools, agencies, and lifecycle services. It is not benchmark evidence or an endorsement.
Conclusion: Use Your Own Baseline
Market benchmarks are source-specific comparisons, not universal targets. Results vary by region, country, and mailbox provider. Compare studies only when their dates, samples, providers, and denominators are similar.
Keep placement separate from delivery failure: message acceptance does not equal inbox placement. Track blocks, bounces, and acceptance failures separately because each calls for a different fix. Keep SMTP response codes, and don’t treat every failure as a list-quality issue.
Use the monthly scorecard to establish normal performance by sender, region, provider, and stream. Before changing platforms or escalating, confirm that an unexplained decline falls outside that baseline and that provider-level evidence supports it. Your own sender baseline is the control. top email marketing platforms can help frame the investigation, but they should not determine the fix.
FAQs
How can I tell if a placement drop needs action?
Act when a drop breaks the usual warning pattern: bounce/complaint spikes → deferrals/throttling → falling inbox placement → blocks. Treat these thresholds as urgent: inbox placement below roughly 72–84% for marketing Gmail Primary or below your target of roughly 90%+, bounces above 2%, or complaints above 0.1%.
Verify SPF/DKIM/DMARC alignment and check for volume spikes. Inbox placement often drops first when sending volume jumps without proper warm-up.
How do I benchmark providers with limited data?
When data is limited, compare each region or campaign against its own past results. Use provider-specific diagnostics instead of industry averages. Focus on real-time visibility into inbox placement, bounce handling, complaint rates, deferrals, blocks, engagement, and authentication alignment.
Use the Email Service Business Directory to find platforms with strong benchmarking tools, native integrations with Google Postmaster Tools or Microsoft SNDS, and automated recency-based suppression. These features can help fill gaps when internal data is limited.
Which deliverability issues should I fix first?
Prioritize list hygiene first, authentication second, and automation third. Suppress hard bounces immediately, then sync those suppressions to your CRM within 24 hours to prevent re-imports. Pause any affected segment with a hard bounce rate above 2%.
If SPF, DKIM, or DMARC failure rates exceed 0.5%, review DNS records and authentication immediately. If queue times exceed 15 minutes, check for DNS, TLS, or throttling problems.