Unified dashboards simplify omnichannel campaign management by consolidating data from platforms like Google, Meta, TikTok, and email tools into one central hub. They eliminate the inefficiencies of fragmented reporting - such as manual data entry, conflicting metrics, and double-counted conversions - allowing teams to save 10–15 hours weekly and reduce reporting time by over 80%. With normalized metrics and real-time updates, businesses can make faster, more accurate decisions, cut wasted ad spend by 47%, and improve ROI by up to 295%.
Key Takeaways:
- Fragmented Reporting Issues: Inflated conversions (30–60%), outdated data (24–48 hours), and 15–20 hours of manual work weekly.
- Unified Dashboard Benefits: Centralized data, multi-touch attribution, real-time updates, and consistent metrics.
- Automation Tools: Tools like Fivetran, Supermetrics, and BigQuery streamline data integration and updates.
- Impact on Performance: Improves cross-channel visibility, reduces budget misallocation, and supports faster decision-making.
Unified dashboards transform data chaos into actionable insights, enabling teams to focus on strategy rather than manual reporting.
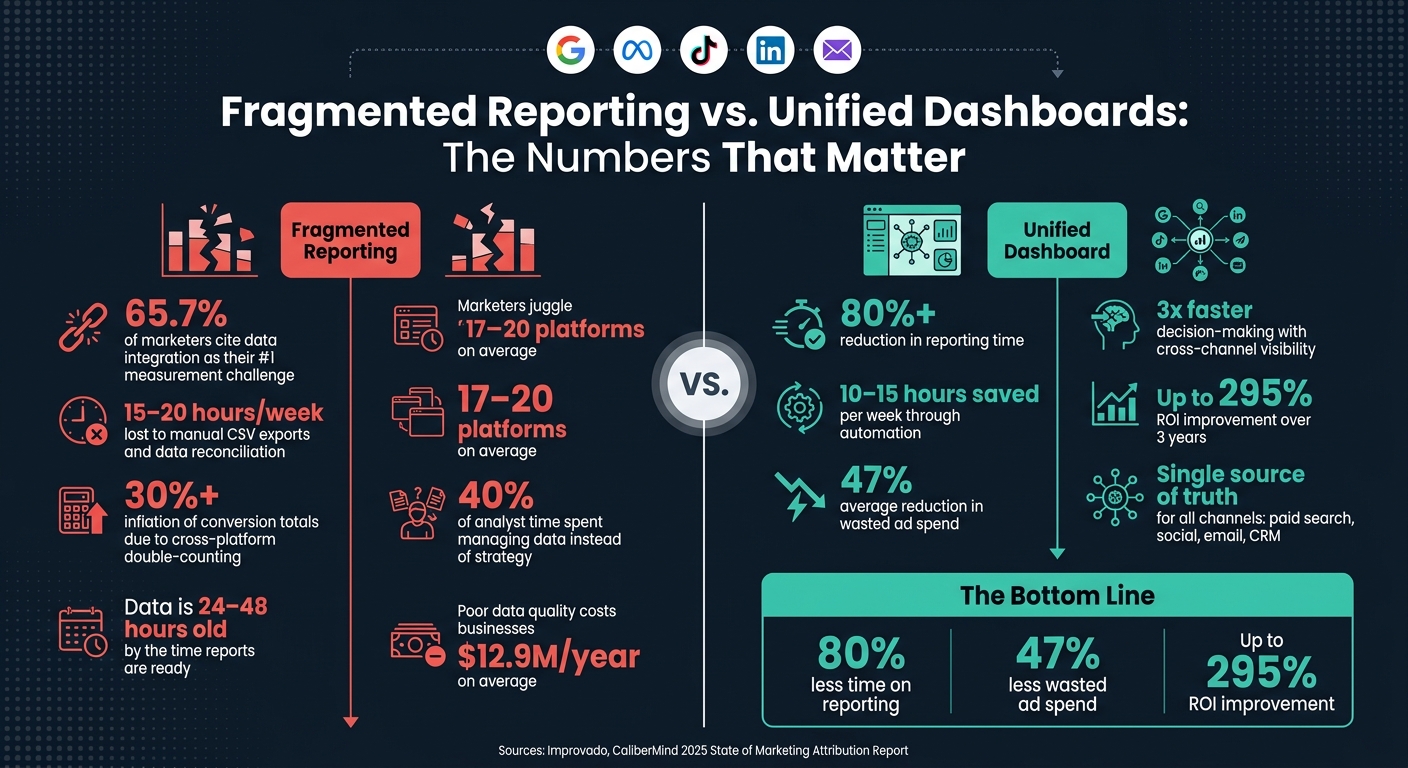
Fragmented vs. Unified Reporting: Key Stats & Impact
Unified Dashboards
sbb-itb-6e7333f
The Problem: Fragmented Channel Reporting
Omnichannel campaigns often use platforms like Google, Meta, TikTok, email, and LinkedIn. But here’s the catch: each one speaks its own “language.” With marketers juggling between 17 and 20 platforms on average, it’s no surprise that 65.7% of them cite data integration as their biggest measurement headache. Without a unified way to view and analyze this data, it quickly turns into a mess, making effective omnichannel management a serious challenge.
Impact on Campaign Performance
Fragmented reporting doesn’t just make things confusing - it actively distorts your results. Different platforms use different tracking methods, which can lead to platforms like Google and Meta both claiming credit for the same sale. This double-counting can inflate conversion totals by 30% or more. If you’re making budget decisions based on these numbers, you could end up funneling money into channels that look good on paper but don’t actually drive revenue.
It’s not just budgets that suffer - cross-team collaboration takes a hit too. Marketing, sales, and finance teams often clash over data definitions, turning meetings into arguments about “whose numbers are right” instead of focusing on actionable insights. As CaliberMind’s 2025 State of Marketing Attribution Report explains:
"When attribution breaks down, it's never the model. It's always the foundation."
These inaccuracies don’t just slow things down - they create bottlenecks that ripple across your operations.
Common Bottlenecks
Fragmented data doesn’t just hurt performance; it also drags down your team’s efficiency. One of the most frustrating inefficiencies is the so-called “login parade.” Imagine hopping between five or more platform tabs just to answer basic cross-channel questions. Then, there’s the manual labor: exporting CSVs, copying data into spreadsheets, and reconciling metrics that don’t quite match. This process eats up 15–20 hours every week.
By the time these reports are ready, the data is already outdated - 24 to 48 hours old. That makes real-time optimization a pipe dream. Privacy updates, like Apple’s iOS 14.5, further complicate things by reducing the reliability of pixel tracking. With much of the data now estimated rather than measured, your insights become even murkier. These bottlenecks highlight the growing need for a unified dashboard that can bring clarity and speed to your reporting.
| Challenge | Weekly Cost | Performance Impact |
|---|---|---|
| Manual CSV exports | 5–15 hours | Data is 24–48 hours old by the time it’s usable |
| "Login parade" across platforms | Ongoing daily drag | No cross-channel view of the customer journey |
| Conflicting KPI definitions | Time lost in debates | Misallocated budget and inaccurate ROAS |
| Attribution inflation | - | Conversion totals exceed actual sales by 30%+ |
Why Unified Dashboards Matter
A unified dashboard is essentially a centralized hub that pulls data from all your marketing channels - think paid search, social media, email platform compatibility, and CRM - and consolidates it in one place. Instead of jumping between platforms and manually piecing together reports, you get a streamlined, standardized view of your data, ready for analysis. This becomes your team’s go-to source for accurate insights, solving the issues of inconsistencies and double-counting that often plague omnichannel campaigns.
By normalizing data - like aligning "conversions" on Google Ads with "purchase events" on Meta - a unified dashboard ensures consistency. This not only saves time but also improves attribution accuracy and helps allocate budgets more effectively.
In fact, unified dashboards can reduce reporting time by a staggering 80% and enable daily optimizations, giving businesses a clear advantage.
Key Benefits
One standout advantage is automated data integration. By eliminating the repetitive cycle of exporting and reconciling data, analysts can save 5–15 hours every week, freeing up time for strategic efforts. These dashboards also cut wasted ad spend by an average of 47%, allowing marketers to pinpoint which channels truly drive results instead of relying on isolated metrics.
Another game-changer is attribution clarity. With fragmented reporting, each platform tends to take full credit for conversions. A unified dashboard, however, uses multi-touch attribution to map the entire customer journey. For example, it connects the dots between a LinkedIn ad, a follow-up email, and a Google retargeting ad, showing how they collectively contribute to a sale. Organizations that have adopted integrated reporting have seen ROI improvements of up to 295% over three years.
Fragmented vs. Unified Reporting: A Direct Comparison
Here’s a side-by-side look at how unified dashboards tackle the challenges of fragmented reporting:
| Feature | Fragmented Reporting | Unified Dashboard |
|---|---|---|
| Reporting Speed | 5–15 hours/week of manual work; data is 24–48 hours old | Real-time or hourly automated updates; 60%+ time savings |
| Data Accuracy | High risk of overcounting; platforms inflate conversions by 30%+ | Normalized and deduplicated data from a single source of truth |
| Attribution | Each channel claims 100% credit for the same sale | Multi-touch view maps the complete customer journey |
| Decision Quality | Reactive; based on stale, siloed snapshots | Proactive; 3x faster decision-making with cross-channel visibility |
Unified dashboards don’t just simplify reporting - they transform how teams analyze, attribute, and act on their marketing data, leading to smarter decisions and better outcomes.
Core KPIs to Track in a Unified Dashboard
When it comes to tracking performance, it’s all about focusing on metrics that guide decisions. Organizing these metrics into three tiers - executive, channel-specific, and diagnostic - ensures that everyone, from top-level executives to campaign managers, gets the insights they need to act effectively.
Executive-Level KPIs
At the executive level, the focus is on metrics that provide a high-level view of marketing performance. Blended ROAS (total revenue divided by total ad spend) stands out as a crucial metric. It helps assess whether the overall marketing strategy is delivering results. Alongside it, Blended CAC (total marketing and sales spend divided by the number of new customers acquired) offers a clear picture of customer acquisition efficiency. As Hooman Radfar, Co-founder and CEO of Collective, puts it:
"The dashboard is our source of truth for CAC and is a key tool in helping us plan our marketing strategy."
Another must-have is Customer Lifetime Value (CLTV), which shows how much you can afford to spend on acquiring a customer. Combine this with Revenue by Channel and Budget Pacing (comparing actual spend to the planned budget), and you’ve got a comprehensive view. The goal here is simplicity - executive dashboards should stick to 6–8 key metrics to avoid unnecessary complexity.
Channel-Specific KPIs
Campaign managers need a more granular view, focusing on how individual platforms are performing. When using the best email marketing platforms, metrics like open rates, click-through rates (CTR), and click-to-open rates (CTOR) are essential. CTOR, in particular, is valuable because it measures content effectiveness by comparing clicks to opens rather than total sends. For paid social and search campaigns, keep an eye on CPM, CTR, and conversion rate.
To ensure accurate cross-platform comparisons, data normalization is critical. For example, map Google Ads' "Cost/conv." and Meta's "Cost per result" into a unified CPA field. Similarly, consolidate conversion metrics across platforms into a single total_conversions field. Without this kind of mapping, comparing performance across channels becomes unreliable.
Diagnostic KPIs
Diagnostic KPIs act as early warning signals, highlighting potential issues before they hit your bottom line. For email campaigns, key benchmarks include a deliverability rate above 95%, a spam complaint rate below 0.1%, and an unsubscribe rate below 1%. Falling short of these thresholds can indicate problems like poor list hygiene, authentication issues (SPF, DKIM, DMARC), or even audience fatigue - issues that can quietly undermine performance.
Here’s a quick reference for diagnostic thresholds across channels:
| Diagnostic KPI | Channel | Warning Threshold |
|---|---|---|
| Deliverability Rate | Below 95% | |
| Spam Complaint Rate | Above 0.1% | |
| Unsubscribe Rate | Above 1% | |
| Unsubscribe Rate | SMS | Above 2% |
| Bounce Rate | Above 5% | |
| Delivery Rate | SMS | Below 95% |
To stay ahead of these issues, automated alerts are essential. If your deliverability rate suddenly dips or spam complaints rise, you want to know immediately - not days later during a routine report review.
Dashboard Setup Requirements
To fully unlock the advantages of unified dashboards, a solid data infrastructure is key. This tackles the bottlenecks mentioned earlier and ensures your dashboards are accurate, efficient, and actionable.
Data Integration
The effectiveness of a unified dashboard depends entirely on the quality and timeliness of the data it receives. This involves connecting all relevant platforms - such as ad networks, CRMs, web analytics tools, email marketing platforms, and e-commerce systems - into one reporting layer. Moving away from manual CSV exports and adopting automated ETL (Extract, Transform, Load) pipelines is a game-changer. Tools like Fivetran, Airbyte, or Supermetrics can automate data extraction via platform APIs, keeping your dashboard updated with the latest numbers instead of outdated spreadsheets.
Different integration methods come with their own pros and cons. For example:
- No-code setups: Using Looker Studio with native connectors can be up and running in just 2–3 hours at no cost, but it primarily supports Google’s ecosystem.
- Enhanced integrations: Adding tools like Supermetrics (priced between $39 and $299/month) broadens your data sources and typically takes 3–5 hours to configure.
- Developer-focused setups: For teams needing full SQL control, combining tools like Metabase, BigQuery, and Fivetran can take 6–10 hours to implement, with monthly costs ranging from $50 to $400.
Data Hygiene and Consistency
While connecting platforms is straightforward, ensuring they "speak the same language" is often where teams hit roadblocks. For instance, different platforms use inconsistent labels for similar actions - Google Ads calls them "conversions", Meta uses "purchase", and LinkedIn refers to "lead_gen_form_submissions." Standardizing these into a unified field like total_conversions is essential.
Additionally, campaign links across platforms should follow a consistent structure, using lowercase utm_source, utm_medium, and utm_campaign parameters without spaces. Functions like LOWER() and TRIM() can help clean up inconsistencies when merging data in your warehouse. Creating a Metric Dictionary - a shared document defining each KPI - ensures everyone across your organization is on the same page. Regular reviews of this document can help maintain alignment.
"Half of multi-channel attribution failures are upstream naming issues. Lock the schema, enforce at trafficking, and the dashboard inherits cleanliness." - Improvado
Once your data is standardized, automating updates becomes the next critical step.
Automation and Real-Time Updates
Manual reporting is a massive time drain, consuming 40–60% of analysts' efforts. Automating scheduled data syncs (every 15–60 minutes) eliminates this inefficiency and ensures dashboards stay current. For example, GA4’s streaming exports to BigQuery have a latency of just 10 minutes, while daily batch exports process at the end of the day. Pre-aggregating data in BigQuery can also help keep dashboard load times under 10 seconds, even when analyzing up to 90 days of history.
To make dashboards proactive rather than reactive, implement anomaly alerts. These can notify you if, for example, spend exceeds the budget by 20% or if conversion rates drop below historical averages.
Data Sources and Metrics
Here’s a breakdown of common data sources, the metrics they support, and how to integrate them:
| Source Type | Key Metrics Supported | Integration Method |
|---|---|---|
| Ad Platforms (Google, Meta, LinkedIn) | Spend, Impressions, Clicks, CPC, CPM, ROAS | API / Supermetrics / Fivetran |
| Web Analytics (GA4, Adobe) | Sessions, Bounce Rate, Goal Completions, On-site Conversions | Native Connector / BigQuery Export |
| CRM (Salesforce, HubSpot) | Leads, MQLs, SQLs, Pipeline Value, Closed-Won Revenue | API / Webhooks |
| Email Marketing (Klaviyo, Mailchimp) | Open Rate, CTR, Unsubscribe Rate, Email-Driven Revenue | API / OAuth |
| E-commerce (Shopify, Stripe) | Total Revenue, AOV, LTV, Transactions | API / Webhooks |
Building a Unified KPI Workflow
Once you’ve centralized your data and standardized your metrics, the next step is creating a repeatable KPI workflow. This ensures your dashboard isn’t just a static tool but a dynamic part of your strategy for omnichannel optimization. A dashboard's true value lies in the habits and processes built around it. A structured workflow enables regular performance reviews that lead to meaningful, strategic actions.
Routine Performance Reviews
The best teams treat dashboard reviews as essential, scheduled events - consistent and organized. A three-tier review schedule works well for most organizations:
| Review Level | Frequency | Primary Focus | Key Metrics |
|---|---|---|---|
| Operational | Daily | Tactical adjustments | CPA, spend pacing, creative CTR |
| Leadership | Weekly | Trend analysis | Channel mix, MQL/SQL volume, ROAS |
| Executive | Monthly | Strategic ROI | CAC, LTV, total revenue, pipeline |
Daily reviews help teams catch immediate issues, like unexpected budget overruns or a sudden spike in CPA. Weekly meetings focus on evaluating broader trends, such as channel performance and lead quality. Monthly sessions zoom out even further, addressing high-level questions like: Are we meeting revenue goals? Do we need to reallocate budgets for the next quarter?
By sticking to this cadence, teams can make cross-channel comparisons more actionable and insightful.
Cross-Channel Comparisons
Simply placing numbers side by side isn’t enough to compare channels effectively. Attribution settings must align across platforms to ensure consistency. For instance, if Google Ads uses a 7-day click attribution window while Meta relies on a 1-day view, their ROAS figures won’t be comparable. Align these settings before drawing conclusions.
Look for patterns across the funnel. One channel may excel at driving awareness with high impressions and low CPA but struggle with conversions. Another might close deals efficiently but have a limited reach. Neither is inherently "better"; each serves a unique role in the overall strategy. A dashboard makes these distinctions clear, ensuring budget decisions are based on actual contributions rather than just last-click attribution.
"A dashboard isn't successful just because it exists. It's successful when it changes decisions." - Improvado
Consider the example of Billy Footwear, an e-commerce brand. In 2026, they adopted LayerFive's ID-resolved attribution system. This allowed them to pinpoint which channels were driving real revenue versus those just claiming credit. As a result, they reallocated their budget and achieved 36% year-over-year revenue growth with only a 7% increase in ad spend.
Adjusting Strategies in Real Time
The real power of a unified dashboard isn’t just in providing visibility - it’s in enabling speedy decision-making. According to Improvado, teams that unify their marketing data reduce reporting time by over 80%, allowing them to optimize campaigns daily rather than weekly.
For instance, you can set up automated alerts via Slack or email for specific triggers, like a CPA increase of more than 50% or a sudden drop in impressions. These alerts keep your team focused on strategy rather than manual monitoring. When an alert is triggered, the dashboard provides the necessary context - spend trends, creative performance, or audience overlap - so teams can quickly identify and address the issue.
Conclusion: What Unified Dashboards Deliver for Omnichannel Campaigns
Unified dashboards solve the chaos of fragmented reporting by pulling real-time data from every channel into one place. Consider this: poor data quality costs businesses an average of $12.9 million per year, and marketers without unified tools spend about 40% of their time managing data instead of focusing on strategy. A unified dashboard eliminates these inefficiencies, replacing manual data wrangling with automated, up-to-the-minute insights across all channels.
This isn't just about saving time - it's about making better decisions. Unified dashboards provide a single source of truth, ensuring everyone, from analysts to executives, works with consistent, reliable data. This clarity keeps conversations focused on what actions to take instead of debating whose data is correct. With accurate cross-channel attribution, faster budget adjustments, and early detection of underperforming channels, teams can act decisively before issues snowball.
The real game-changer? Unified dashboards turn omnichannel campaign management from a reactive grind into a proactive, data-driven process. The investment in this infrastructure doesn't just save hours - it creates a ripple effect of smarter, faster decisions that amplify results across every channel.
FAQs
What data should be included in a unified dashboard?
A unified dashboard brings together data from all your active marketing channels into one central hub. This includes paid search, social media, email campaigns, organic search, CRM systems, web analytics, and even offline events. By consolidating this information, you create a single, reliable source of truth for your marketing performance.
To make the most of your dashboard, prioritize 8–12 key performance indicators (KPIs) that align with your business goals. Examples of these KPIs include customer acquisition cost (CAC), return on ad spend (ROAS), and lifetime value (LTV). These metrics provide a clear picture of how well your efforts are driving results.
For businesses looking for tools to streamline this process, the Email Service Business Directory is a valuable resource to explore. It can help you find the right platforms to support your data integration and analysis needs.
How do unified dashboards prevent double-counted conversions?
Unified dashboards solve the problem of double-counted conversions by consolidating data from multiple platforms into a single source of truth. They align attribution windows and standardize metrics, ensuring all channels use consistent definitions. By connecting directly to tools like your CRM or payment processor - systems that track real transactions - these dashboards streamline conversion tracking and eliminate discrepancies caused by conflicting platform rules.
How do I normalize KPIs so channels compare fairly?
To make sure your KPIs can be compared across different channels, it's essential to standardize some key elements. Start by defining conversions in the same way for all platforms - whether that's a lead form submission or a purchase. Use a consistent attribution model and time window, such as a 7-day click, to keep tracking uniform. Additionally, adopt a single UTM naming convention to ensure clarity in your data.
When dealing with platform-specific metrics like Cost per Conversion (Cost/Conv) and Cost per Acquisition (CPA), align them to a common standard for easier comparison. Tools listed in the Email Service Business Directory can simplify this process and help you manage data efficiently.